Profit Margins by Industry: Complete Benchmark Guide
See average gross, operating, and net profit margins across 50+ industries. Distribution, manufacturing, retail, and service industry benchmarks.
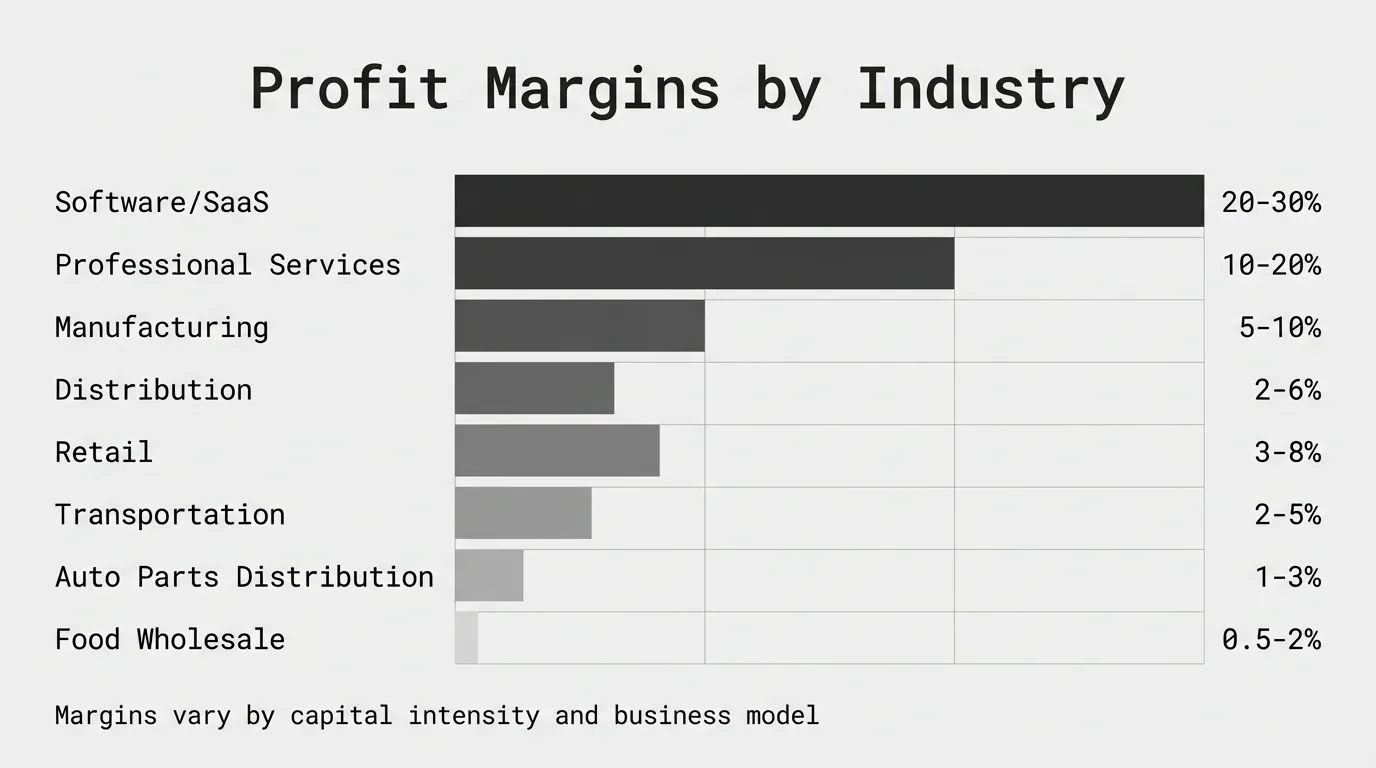
Profit margins by industry vary from 0.5% to 30% depending on business model, capital intensity, and competitive dynamics. Software companies operate at 20-30% net margins. Food wholesalers run on 0.5-2%. Manufacturing averages 5-10%. Distribution averages 2-6%.
Understanding where your margins fall relative to industry benchmarks tells you whether you have a pricing problem, a cost problem, or an operational problem. A manufacturer with 18% gross margin when the industry average is 32% has a sourcing or pricing issue. A distributor with 4% operating margin when peers average 8% is spending too much on overhead.
This guide provides profit margin benchmarks across 50+ industries, explains what drives margin differences, and shows how to use this data to evaluate your own performance.
Understanding the Three Profit Margins
Before comparing your business to benchmarks, clarify which margin type you're measuring. Each answers a different question:
Gross Margin
Gross Margin = (Revenue - Cost of Goods Sold) / Revenue × 100Gross margin measures what remains after subtracting direct costs. For distributors, that's purchase cost. For manufacturers, it's materials, direct labor, and production overhead. This metric shows whether your core business model is viable before considering operating expenses.
Operating Margin
Operating Margin = (Revenue - COGS - Operating Expenses) / Revenue × 100Operating margin includes operating expenses like salaries, rent, utilities, and marketing. It measures whether your business model works at current scale. Two companies with identical gross margins can have very different operating margins based on operational efficiency.
Net Profit Margin
Net Profit Margin = Net Income / Revenue × 100Net margin is the bottom line after all expenses, interest, and taxes. It's the ultimate test of business viability. This is usually what people mean when they ask "what's your profit margin?"
A complete margin analysis examines all three. A distributor with 28% gross margin, 12% operating margin, and 3% net margin spends 16 points on operating expenses and 9 points on interest, taxes, and other costs.
For a deeper understanding of margin analysis methodology, see our complete margin analysis guide.
Comprehensive Profit Margin Benchmarks by Industry
Data compiled from NYU Stern's industry margin database (January 2026), Vena Solutions industry benchmarking, FullRatio industry profitability data, and industry association reports.
Distribution and Wholesale Industries
Distribution operates on thin margins because the business model is buying and reselling with limited transformation. Margin comes from efficiency, service value, and pricing discipline.
| Industry Segment | Gross Margin | Operating Margin | Net Margin | Notes |
|---|---|---|---|---|
| Industrial Distribution | 22-30% | 3-7% | 2-6% | Broad category including electrical, HVAC, industrial supply |
| Electrical Distribution | 24-28% | 4-6% | 3-5% | Higher margins from technical expertise |
| HVAC Distribution | 23-27% | 3-6% | 2-5% | Seasonal demand impacts margins |
| Building Materials Distribution | 20-28% | 2-5% | 1-4% | Commodity pressure, high delivery costs |
| Plumbing Distribution | 24-29% | 4-6% | 3-5% | Service differentiation supports margins |
| Electronics Distribution | 12-18% | 2-4% | 1-3% | Technology commoditization, short product cycles |
| Auto Parts Distribution | 14-20% | 2-4% | 1-3% | High competition, commodity products |
| Food Wholesalers | 13-18% | 1-3% | 0.5-2% | Volume business, extremely thin margins |
| Medical Distribution | 25-32% | 4-7% | 3-6% | Regulatory barriers create margin protection |
| Specialty Distribution | 28-38% | 5-9% | 4-8% | Niche products, value-added services |
According to McKinsey's 2019 industrial distribution research, top-performing distributors ("legends") maintain EBITDA margins of 8-12%, while average distributors achieve 4-6%. EBITDA margin is typically 2-3 percentage points higher than net margin.
Manufacturing Industries
Manufacturing margins vary widely based on capital intensity, product complexity, and competitive positioning. Custom and specialty manufacturers command higher margins than commodity producers.
| Industry Segment | Gross Margin | Operating Margin | Net Margin | Notes |
|---|---|---|---|---|
| General Manufacturing | 25-35% | 7-12% | 5-10% | Broad category baseline |
| Machinery Manufacturing | 32-40% | 8-13% | 6-11% | Engineered products, technical complexity |
| Industrial Equipment | 30-38% | 7-12% | 5-10% | Mix of standard and custom products |
| Fabricated Metal Products | 28-35% | 6-11% | 4-9% | Job shop vs. production shop variation |
| Auto Manufacturing | 12-18% | 4-8% | 2-6% | High capital intensity, intense competition |
| Electronics Manufacturing | 25-32% | 6-10% | 4-8% | Component commoditization pressure |
| Chemical Manufacturing | 22-30% | 8-14% | 6-12% | Process efficiency drives margins |
| Pharmaceutical Manufacturing | 65-75% | 20-30% | 15-25% | Patent protection, high R&D costs |
| Food Manufacturing | 18-28% | 5-9% | 3-7% | Commodity inputs, brand differentiation |
| Plastic Products Manufacturing | 24-32% | 6-11% | 4-9% | Material costs drive margin volatility |
| Custom Manufacturing | 32-42% | 10-16% | 7-13% | Engineered-to-order premium pricing |
The Deloitte 2026 Manufacturing Industry Outlook projects median EBITDA as a percent of net revenues will increase 9.4% in 2026 as companies adapt to recent economic uncertainties. Most manufacturing CEOs are more optimistic about improving profit margins in 2026 compared to 2024-2025.
Retail Industries
Retail margins depend on product category, store format, and private label penetration. Online retailers often have higher gross margins but similar net margins due to marketing costs.
| Industry Segment | Gross Margin | Operating Margin | Net Margin | Notes |
|---|---|---|---|---|
| Grocery Retail | 22-28% | 2-4% | 1-3% | High volume, low margin business model |
| General Merchandise Retail | 28-35% | 4-8% | 2-6% | Department stores, big box retailers |
| Specialty Retail | 35-48% | 6-12% | 4-9% | Apparel, sporting goods, home goods |
| Furniture Retail | 40-50% | 8-14% | 5-10% | High margins offset low inventory turns |
| Auto Parts Retail | 38-45% | 7-12% | 4-9% | Aftermarket parts, installation services |
| Electronics Retail | 20-28% | 3-6% | 2-5% | Commoditization, showrooming pressure |
| E-commerce Retail | 30-42% | 2-8% | 1-6% | High gross margins, high customer acquisition costs |
Retail is transitioning from margin expansion through inventory management to margin defense through omnichannel efficiency.
Service Industries
Service industries generally have higher gross margins because COGS is primarily labor. Operating margins vary based on scalability and leverage.
| Industry Segment | Gross Margin | Operating Margin | Net Margin | Notes |
|---|---|---|---|---|
| Professional Services | 50-70% | 10-20% | 8-16% | Consulting, accounting, legal services |
| IT Services | 40-55% | 8-15% | 6-12% | Project-based, labor arbitrage models |
| Software/SaaS | 70-85% | 15-25% | 10-30% | High gross margins, scaling investment phase |
| Healthcare Services | 35-50% | 8-15% | 5-12% | Labor-intensive, regulatory constraints |
| Financial Services | 60-80% | 20-35% | 15-25% | Asset-light model, scale economics |
| Transportation/Logistics | 22-32% | 3-7% | 2-5% | Fuel, labor, equipment costs |
| Construction Services | 15-25% | 4-8% | 2-6% | Competitive bidding, project risk |
Software and financial services enjoy high margins from operating leverage. As revenue grows, costs grow slower, expanding margins. Service businesses with linear scaling (more revenue requires proportionally more labor) have lower margins.
What Drives Margin Differences Between Industries
Five factors explain most margin variation across industries:
1. Capital Intensity
Industries requiring heavy upfront investment in equipment, facilities, or inventory typically operate on lower margins. Auto manufacturing requires billions in tooling and factories. Distribution needs warehouse space and working capital for inventory. These capital costs manifest as depreciation and interest expense, compressing net margins.
Software requires minimal capital beyond labor. Once the product is built, serving additional customers costs almost nothing. This operating leverage produces 70%+ gross margins.
2. Competitive Intensity
Commodity products in crowded markets drive margins toward zero. Food wholesaling, auto parts distribution, and electronics retailing face intense price competition because products are interchangeable and customers switch easily.
Specialty businesses with differentiation, technical expertise, or regulatory barriers maintain higher margins. Medical device distribution, custom manufacturing, and pharmaceutical production have margin protection from factors beyond pure price competition.
3. Value Addition
The more transformation or service wrapping your business adds, the higher your sustainable margin. A steel service center that cuts, coats, and delivers just-in-time earns higher margins than one that simply warehouses and ships standard sizes.
Manufacturing adds more value than distribution, which explains the 10-15 percentage point gross margin difference. Custom engineering adds more value than standard production, which explains premium margins for made-to-order manufacturers.
4. Customer Concentration and Power
When customers have negotiating power through size or switching ability, margins compress. Distributors serving large retail chains or automotive OEMs operate on thin margins because customers dictate terms.
Businesses serving fragmented customers or providing mission-critical products maintain pricing power. B2B companies selling to thousands of small customers typically have higher margins than those dependent on 10 large accounts.
5. Operating Leverage
Businesses with high fixed costs and low variable costs see margin expansion as revenue grows. A manufacturer running at 60% capacity has lower margins than one at 85% capacity because fixed costs are spread across more units.
Distribution has lower operating leverage because costs scale more linearly with volume. Growth requires more warehouse space, more inventory, and more delivery trucks. Software has extreme operating leverage because serving twice as many customers requires minimal additional cost.
How to Use These Benchmarks
Industry benchmarks provide context but require careful interpretation. Here's how to use them effectively:
Match Your Business to the Right Category
Don't compare yourself to "general distribution" if you're an electrical distributor. The more specific the benchmark match, the more useful the comparison.
If your business spans multiple categories (you distribute some commodity products and some specialty products), segment your analysis. Calculate margins separately for each product line and compare each to its relevant benchmark.
Compare to the Range, Not the Average
An average of 5% doesn't mean everyone clusters around 5%. Distribution net margins range from 1% to 8%. If you're at 2%, you're in the bottom quartile but not necessarily broken. If you're at 0.5%, you have urgent problems.
Position matters more than precision. Are you in the top quartile, middle half, or bottom quartile? Movement matters too. If you were at 4% last year and 2% this year, investigate what changed.
Analyze Margin Gaps Systematically
If your margins are below industry benchmarks, identify where the gap originates:
Low gross margin relative to industry: You have a pricing problem (selling too cheap) or a sourcing problem (buying too expensive). Solutions involve price discipline, supplier negotiation, or product mix optimization. See our guide on how to improve profit margins.
Normal gross margin but low operating margin: You're spending too much on overhead or operations. Solutions involve process efficiency, technology adoption, or organizational structure changes.
Normal operating margin but low net margin: The problem is below the operating line—interest expense, one-time charges, or tax inefficiency. Solutions involve debt refinancing, accounting review, or tax strategy.
Consider Business Model Differences
Two distributors can have different margins while both being healthy. One might prioritize volume over margin, running at 2% net margin on $100M revenue ($2M profit). Another might prioritize margin over volume, running at 6% net margin on $40M revenue ($2.4M profit).
Which is better? Depends on market position, growth trajectory, and strategic goals. The $100M distributor has market share and leverage. The $40M distributor has margin cushion and operational flexibility.
Account for Business Cycle and Seasonality
Margins fluctuate with economic cycles and seasonal demand. An HVAC distributor might show 5% net margin in Q3 (cooling season) and 1% in Q1 (slow season). Annual margins smooth these fluctuations.
In economic downturns, margins typically compress across all industries as companies protect volume through pricing concessions. In recoveries, margins expand as pricing discipline returns. Compare your margin trend to industry trend, not just your absolute margin to industry average.
Distribution Industry Margin Benchmarks in Detail
Distribution operates on thin margins by design. You're buying finished goods and reselling them, often to price-sensitive customers. Your value comes from availability, delivery, technical support, and product selection—not from transforming the product.
What "Good" Looks Like for Distributors
According to McKinsey's research on industrial distribution performance:
Average distributors:
- Gross margin: 22-28%
- Operating margin: 3-5%
- Net margin: 2-4%
- EBITDA margin: 4-6%
Top-performing distributors ("legends"):
- Gross margin: 28-35%
- Operating margin: 6-9%
- Net margin: 4-8%
- EBITDA margin: 8-12%
The difference? Top performers maintain pricing discipline, optimize product mix toward higher-margin items, control operating expenses, and leverage technology to reduce cost-to-serve.
Distribution Margin Patterns by Channel
Contractor channel: Higher margins (26-32% gross) due to technical support, job site delivery, and project management services. Contractors value speed and reliability over lowest price.
Large account channel: Lower margins (18-24% gross) due to volume commitments and competitive bidding. Margin comes from operational efficiency at scale.
MRO channel: Mixed margins (22-30% gross) depending on customer concentration and breadth of offering. Convenience and availability support margin.
Why Distribution Margins Are Compressed
Three structural factors keep distribution margins thin:
-
Limited product differentiation: Most distributors sell the same manufacturer brands. Price becomes the primary differentiator unless you add services.
-
Customer price visibility: Online pricing, group purchasing organizations, and multiple suppliers give customers leverage.
-
Operating expense pressure: Labor costs, delivery expenses, and inventory carrying costs are rising faster than pricing power allows margin expansion.
Successful distributors combat compression through value-added services, technical expertise, inventory optimization, and operational efficiency. See our guide to distribution pricing strategy for specific tactics.
Manufacturing Industry Margin Benchmarks in Detail
Manufacturing margins vary more widely than distribution because product complexity, customer concentration, and capital intensity differ dramatically across segments.
What "Good" Looks Like for Manufacturers
General manufacturing (mid-market):
- Gross margin: 28-35%
- Operating margin: 8-12%
- Net margin: 6-10%
Custom/job shop manufacturing:
- Gross margin: 35-45%
- Operating margin: 12-18%
- Net margin: 8-14%
High-volume/commodity manufacturing:
- Gross margin: 18-28%
- Operating margin: 5-10%
- Net margin: 3-7%
The difference comes down to standardization vs. customization. Custom manufacturers earn premium margins through engineering expertise and customer-specific solutions. High-volume manufacturers compete on efficiency and scale.
Manufacturing Margin Improvement Trends
The Deloitte 2026 Manufacturing Outlook projects margin improvement this year as economic conditions stabilize. Key drivers:
- Cost pass-through: Manufacturers successfully passing through 2022-2024 material and labor cost increases
- Operational efficiency: Automation and process improvement driving productivity gains
- Product mix optimization: Shift toward higher-margin specialty products and away from commodities
- Pricing discipline: Market consolidation reducing destructive price competition
Median EBITDA as a percent of revenues is expected to increase 9.4% in 2026 compared to 2024-2025 levels.
Manufacturing Margin by Production Model
Make-to-stock (standard products): Lower gross margins (22-32%) due to competitive pressure but higher operating leverage from production efficiency.
Make-to-order (custom products): Higher gross margins (32-45%) from engineering value-add but lower operating leverage due to job-specific costs.
Configure-to-order (modular customization): Middle ground (28-38% gross) combining some standardization benefits with customization premium.
For deeper analysis of manufacturing pricing strategy and margin optimization, see our manufacturing pricing guide.
Margin Trends and Economic Factors
Profit margins don't exist in a vacuum. They expand and contract with economic conditions, competitive dynamics, and industry-specific disruption.
Recent Margin Trends (2020-2026)
2020-2021: Margin volatility Supply chain disruptions, demand shocks, and cost spikes created extreme margin volatility. Companies with pricing power maintained margins. Commodity businesses saw compression.
2022-2023: Margin compression Inflation in labor, energy, and materials outpaced pricing increases for most industries. According to FullRatio's industry margin analysis, average net margins declined 1-2 percentage points across manufacturing and distribution.
2024-2025: Recovery and stabilization Successful cost pass-through and operational adjustments allowed margin recovery. Supply chains normalized. Inflation moderated. Most industries returned to 2019 margin levels.
2026: Cautious optimism Industry surveys show most executives expect margin improvement in 2026. Key factors: stable input costs, pricing discipline, and efficiency gains from technology investment.
Factors Compressing Margins Long-Term
E-commerce and price transparency: Customers can compare prices instantly, reducing pricing power. Industries with high online penetration see persistent margin pressure.
Customer consolidation: In many B2B industries, customers are consolidating through M&A, increasing negotiating power. Large buyers demand volume discounts and annual price concessions.
Commoditization: Technology acceleration shortens product differentiation windows. Yesterday's specialty product becomes today's commodity faster than before.
Labor cost inflation: Warehouse, delivery, and skilled trade labor costs are rising faster than productivity improvements can offset.
Factors Supporting Margins
Technology-enabled efficiency: Companies investing in automation, analytics, and digital tools can maintain margins through productivity. Cost-to-serve decreases faster than price pressure increases.
Product and service bundling: Combining products with services, data, or ongoing support creates differentiation that supports premium pricing.
Specialization: Narrowing focus to defensible niches with high switching costs protects margins better than broad commodity plays.
Pricing analytics: Data-driven pricing optimization captures 1-3 percentage points of margin without losing volume. See our pricing optimization guide for methodology.
Common Margin Analysis Mistakes
Mistake 1: Comparing Different Margin Types
"Our profit margin is 28% but the industry average is 6%—we're crushing it!" Not necessarily. That 28% might be gross margin while the benchmark is net margin. Always compare apples to apples.
Mistake 2: Ignoring Segment Mix
Your overall margin might match industry benchmarks while hiding severe problems in specific segments. A distributor with 4% net margin might have half their business at 8% and half at 0%. The average looks fine but half the business is broken.
Mistake 3: Using Outdated Benchmarks
Industry margins shift with economic conditions. 2019 benchmarks don't reflect 2024-2026 realities of inflation, supply chain changes, and labor cost increases. Use current data from NYU Stern, updated quarterly.
Mistake 4: Accepting Industry Average as "Good"
Industry average includes poorly-run companies. If your industry averages 4% net margin and you're at 4%, you're in the middle of the pack—which includes companies barely surviving. Top quartile performance is the aspiration, not average.
Mistake 5: Focusing Only on Margin Percentage
A company with 8% net margin on $20M revenue makes $1.6M. A company with 4% net margin on $60M revenue makes $2.4M. Which is better? Depends on your goals. Margin percentage and absolute profit both matter.
Mistake 6: Neglecting Margin Quality
Not all margin is created equal. Margin from structural pricing power is sustainable. Margin from temporary cost deferrals or one-time gains is fragile. Analyze what's driving your margin, not just the percentage.
How to Access Current Industry Benchmark Data
Several sources provide regularly updated industry margin data:
NYU Stern (Free)
NYU Stern's industry margin database provides gross, operating, and net margins for 100+ industry categories, updated quarterly. Data comes from publicly traded companies but approximates private company performance in the same industries.
Download the Excel file for detailed breakdowns and historical trends. Data is current as of January 2026.
Industry Associations (Member Access)
Trade associations provide member benchmarking for specific industries:
- NAW (National Association of Wholesaler-Distributors): Benchmarking studies for wholesale distribution
- NAED (National Association of Electrical Distributors): Electrical distribution benchmarks
- MHEDA (Material Handling Equipment Distributors Association): Material handling distribution data
- AD (Associated Distribution): Member benchmarking across multiple distribution verticals
- NAMA (National Automatic Merchandising Association): Vending and micro-market margins
These provide more detailed and current data than public sources but require membership.
Benchmark Services (Paid)
Commercial benchmarking services provide detailed, subscription-based access:
- IBISWorld: Industry reports with profitability metrics
- Financial Rhythm: Margin analysis by industry
- Vena Solutions: Industry benchmark reports
- FullRatio: Profit margin by industry data
Your ERP Vendor
Many ERP systems offer industry comparison reports for customers. NetSuite, SAP Business One, Acumatica, and Dynamics 365 provide margin benchmarking tools that compare your data to anonymized industry peers using the same system.
Taking Action Based on Benchmark Comparisons
Knowing your margins are below industry benchmarks is the starting point, not the endpoint. Here's how to respond:
If Your Gross Margin Is Low
Immediate actions:
- Audit pricing discipline across product categories and customer segments
- Identify products where you haven't passed through cost increases
- Review customer-specific pricing for deals negotiated years ago that no longer reflect costs
- Analyze product mix shifts toward lower-margin items
Strategic actions:
- Implement price waterfall analysis to find margin leakage
- Develop tiered pricing based on service level and volume
- Rationalize SKUs, eliminating low-margin products without strategic value
- Renegotiate supplier agreements or consolidate suppliers for better terms
See our guide on price waterfall analysis for systematic margin leakage detection.
If Your Operating Margin Is Low
Immediate actions:
- Compare operating expense ratios to industry benchmarks by category
- Identify overhead costs growing faster than revenue
- Review headcount productivity metrics
- Audit technology spending for unused or redundant systems
Strategic actions:
- Automate repetitive processes reducing labor intensity
- Implement territory optimization and route planning to reduce delivery costs
- Consolidate facilities or renegotiate leases
- Outsource non-core functions where external providers have scale advantages
If Your Net Margin Is Low
Immediate actions:
- Review debt structure and refinancing opportunities
- Audit interest expense relative to working capital needs
- Examine tax strategy and deduction optimization
- Identify one-time charges distorting comparisons
Strategic actions:
- Improve working capital efficiency to reduce borrowing needs
- Consider ownership structure changes affecting tax treatment
- Evaluate M&A opportunities to consolidate for better margins
- Review capital allocation to higher-margin business segments
For systematic margin improvement methodology, see our guide on how to improve profit margins.
Conclusion
Profit margins by industry range from razor-thin (0.5% for food wholesalers) to substantial (30% for software companies). These differences aren't arbitrary. They reflect capital requirements, competitive intensity, value addition, and operating leverage inherent to each industry's business model.
Your margins tell you whether your business is healthy relative to structural constraints. A 2% net margin is terrible for a software company but solid for a food distributor. Context matters.
Use industry benchmarks as diagnostic tools, not report cards. If your margins fall below industry norms, identify which margin shows the gap. Low gross margin points to pricing or sourcing issues. Normal gross margin but low operating margin means overhead problems. Normal operating margin but low net margin suggests below-the-line inefficiency.
The best companies don't settle for industry average. They target top quartile performance through pricing discipline, operational efficiency, product mix optimization, and strategic positioning. That's where the defensible profit margins live.
For systematic margin analysis and improvement, explore our related guides on margin analysis, margin leakage detection, and pricing optimization.
Last updated: February 24, 2026
Related Articles
Frequently Asked Questions

Want to analyze your entire product catalog?
Pryse automatically identifies margin leakage across thousands of SKUs. Upload your data and find hidden profit in 24 hours.
One-time $1,499 diagnostic. No subscription required.