What Is a Good Net Profit Margin for Manufacturing? Targets by Company Size & Sector
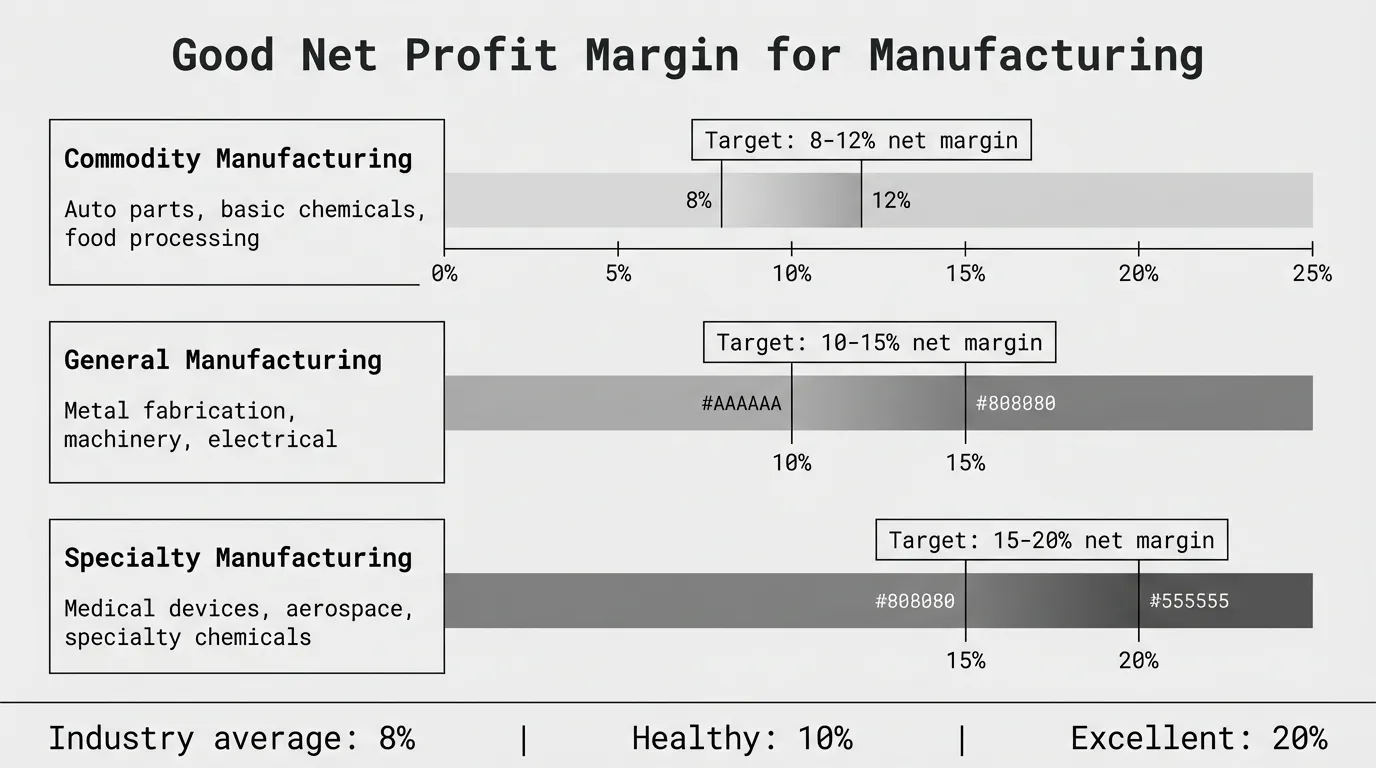
A good net profit margin for manufacturing is 10-20%. Commodity manufacturers target 8-12%, general manufacturers 10-15%, and specialty manufacturers 15-20%.
A good net profit margin for manufacturing is 10-20%, but what counts as "good" depends on what you make and how you compete. A 12% net margin is excellent for a manufacturer producing commodity fasteners. The same 12% is mediocre for a specialty chemicals company that should be running 15-18%.
According to TrueProfit's 2026 margin benchmarks, 5% net margin is low, 10% is healthy, and 20% is high for manufacturing. The industry average sits around 8%—below the healthy threshold.
Commodity manufacturers competing on price should target 8-12% net margin. General manufacturers with moderate differentiation should aim for 10-15%. Specialty manufacturers with proprietary products or technical barriers should achieve 15-20%.
What Is Considered a Good Net Profit Margin for Manufacturing?
Net profit margin is what remains after all costs—COGS, operating expenses, interest, and taxes. It represents true business profitability, not just product margins.
Net Profit Margin = Net Profit / Revenue × 100According to Vena Solutions' industry benchmarking data, manufacturers typically achieve 5-10% net margins. FullRatio's profitability analysis shows similar patterns across manufacturing sectors.
A good net profit margin sits above these averages. It represents top-quartile performance—proof that a manufacturer has pricing discipline, operational efficiency, or both.
Net profit margin benchmarks:
| Performance Level | Net Margin Range | What It Signals |
|---|---|---|
| Below Average | Under 8% | Pricing pressure, operational inefficiency, or both |
| Average | 8-10% | Industry-typical performance |
| Good | 10-15% | Above-average pricing power or operational control |
| Excellent | 15-20% | Top-quartile profitability, strong differentiation |
| Outstanding | 20%+ | Exceptional differentiation, pricing power, or efficiency |
These targets apply to established manufacturers at steady-state operations. High-growth manufacturers often run lower margins temporarily while scaling capacity. Turnarounds may show poor margins until improvements take effect.
Good Net Profit Margin for Manufacturing by Sector
Manufacturing isn't one industry. A pharmaceutical manufacturer has nothing in common with an auto parts supplier. Good net margins vary dramatically by what you make.
| Manufacturing Sector | Good Net Margin | Average Net Margin | What Drives Good Performance |
|---|---|---|---|
| Auto Parts | 8-10% | 3-6% | Volume efficiency, cost control, material sourcing |
| Chemicals (Basic) | 10-12% | 5-8% | Scale economies, process efficiency, vertical integration |
| Chemicals (Specialty) | 15-18% | 9-14% | Technical expertise, IP, customer application knowledge |
| Electrical Equipment | 12-15% | 6-10% | Product quality, brand strength, distribution relationships |
| Food Processing | 8-10% | 4-7% | Scale, waste control, material sourcing, logistics efficiency |
| Industrial Machinery | 12-15% | 7-11% | Engineering capability, aftermarket revenue, service contracts |
| Metal Fabrication | 12-14% | 4-8% | Precision capability, quality systems, delivery reliability |
| Pharmaceuticals | 25-30% | 20-30% | Intellectual property, regulatory barriers, R&D productivity |
| Plastics & Rubber | 10-12% | 4-8% | Material sourcing, process efficiency, capacity utilization |
| Semiconductors | 20-25% | 15-25% | Technology leadership, scale economies, manufacturing yields |
Data compiled from NYU Stern's margin database (January 2026), Vena Solutions benchmarking, and top-quartile company performance.
The pattern is clear: sectors producing differentiated, high-value products achieve higher net margins. Sectors producing commodity products set lower targets but still show meaningful gaps between average and good.
A $35M specialty chemicals manufacturer running 16% net margin demonstrates good performance for that sector. The same 16% would be outstanding for a basic chemicals manufacturer but unrealistic for auto parts.
Net Profit Margin Targets by Manufacturer Type
The biggest net margin difference in manufacturing isn't sector-specific. It's business model. Your competitive environment determines achievable margin targets.
Commodity Manufacturing
What qualifies as commodity:
- Standardized products with multiple suppliers
- Customer switching costs are low or zero
- Competition based primarily on price and delivery
- Examples: Standard fasteners, basic chemicals, commodity metal parts, basic food processing
Good net margin target: 8-12%
What drives good performance:
- Being the low-cost producer through scale and efficiency
- Superior capacity utilization (85%+ consistently)
- Material cost advantages from sourcing or vertical integration
- Process efficiency with low scrap and high yields
- Working capital optimization reducing cash needs
A $40M fastener manufacturer producing standard bolts targets 10% net margin. Achieving this requires relentless focus on cost position because customers view products as interchangeable. Any manufacturer hitting double-digit net margins on commodity products demonstrates operational excellence.
Commodity manufacturers accepting net margins below 8% need to either reduce costs dramatically or find ways to differentiate. At 5-6% net margin, there's no buffer for economic downturns, cost shocks, or competitive pricing pressure.
General Manufacturing
What qualifies as general manufacturing:
- Mix of standard and custom products
- Moderate customer switching costs
- Competition based on price, quality, and service
- Examples: Metal fabrication, plastics molding, machining shops, assembly operations
Good net margin target: 10-15%
What drives good performance:
- Balanced portfolio of standard (higher volume) and custom (higher margin) work
- Process efficiency and quality systems that reduce rework
- Customer relationships that justify above-commodity pricing
- Operational scale providing cost advantages
- Strategic sourcing and supplier management
A $55M metal fabrication company serving industrial OEMs targets 12% net margin. This margin supports the infrastructure needed to deliver quality and reliability customers expect while generating adequate owner returns.
General manufacturers running below 10% net margin need to either move toward commodity efficiency (higher volume, lower cost) or specialty differentiation (higher margin, more value). The middle ground without competitive advantage is challenging.
Specialty Manufacturing
What qualifies as specialty:
- Differentiated products with technical barriers or IP
- High customer switching costs (qualification, integration, risk)
- Competition based on capability, quality, and value
- Examples: Medical devices, aerospace components, precision instruments, specialty chemicals
Good net margin target: 15-20%
What drives good performance:
- Strong technical capabilities and application expertise
- Customer intimacy enabling value-based pricing
- Intellectual property or process know-how creating barriers
- Quality systems and certifications limiting competition
- Product portfolio management favoring high-value applications
A $30M precision machining company serving aerospace and medical devices targets 18% net margin. These margins reflect pricing power from regulatory barriers, tight tolerances, and customer qualification requirements that prevent competition from low-cost alternatives.
Specialty manufacturers running 10-12% net margin aren't capturing appropriate value for their differentiation. Either pricing is too cost-based or operations carry excess costs that dilute the margin advantage.
How Company Size Affects Good Net Margin Targets
Larger manufacturers typically achieve better margins through scale economies. But scale also brings complexity and overhead. Good net margins vary by size.
Small Manufacturers (Under $20M Revenue)
Good net margin target: 10-15%
Small manufacturers can't compete on scale. Good performance comes from specialization, customer intimacy, or operational agility.
A $12M precision parts manufacturer serving niche aerospace applications runs 16% net margin by focusing on a narrow technical domain where they have expertise. The smaller scale allows tight cost control and direct customer relationships that larger competitors can't match.
Small manufacturers accepting commodity net margins below 10% rarely grow beyond $20M. The margin doesn't support the infrastructure, talent, systems, and capital investment needed to scale.
Why higher margins matter for small manufacturers:
- Limited access to capital requires internal cash generation
- Can't spread fixed costs over large volume
- Need margin cushion to survive customer concentration risk
- Must fund growth entirely from profits
Mid-Size Manufacturers ($20M-$100M Revenue)
Good net margin target: 12-16%
Mid-size manufacturers gain some scale benefits but haven't reached full efficiency. Good performance balances growth investment with profitability.
A $65M industrial equipment manufacturer running 14% net margin demonstrates solid performance—enough margin to fund organic growth, maintain facilities and equipment, service debt, and generate owner returns.
Mid-size manufacturers running below 10% net margin struggle to invest in people, systems, and capacity needed to reach the next scale tier. Those running above 18% net margin either have strong differentiation or may be under-investing in growth.
What separates good from average at this scale:
- Pricing discipline as volume grows (avoiding the "volume at any margin" trap)
- Operating expense control as percentage of revenue
- Balance between standardization (for efficiency) and customization (for margin)
- Product portfolio management steering mix toward better margins
Large Manufacturers ($100M-$500M Revenue)
Good net margin target: 12-18%
Large manufacturers benefit from scale but face margin pressure from sophisticated customers and competitive intensity. Good performance means maintaining margin discipline as volume grows.
A $280M manufacturer running 15% net margin shows they've captured scale benefits without sacrificing pricing discipline. This requires systematic processes for pricing, costing, and operational efficiency.
Large manufacturers running below 10% net margin either operate in commodity sectors (acceptable) or have allowed operational complexity to erode margins (problematic). Those running above 18% net margin have achieved true differentiation or operate in favorable niches.
Challenges large manufacturers face:
- Sophisticated customers with professional procurement teams
- Competitive intensity from both domestic and international manufacturers
- Organizational complexity that can inflate overhead
- Pressure to maintain utilization leading to margin-dilutive business
Good Net Margin vs. Good Gross Margin: What's the Difference?
Gross margin and net margin tell different profitability stories. A manufacturer can have good gross margin but poor net margin if business operations are inefficient.
Gross margin measures product profitability:
Gross Margin = (Revenue - COGS) / Revenue × 100COGS includes materials, direct labor, and manufacturing overhead. Gross margin shows how much you keep from each revenue dollar after making the product.
Net margin measures business profitability:
Net Profit Margin = Net Profit / Revenue × 100Net profit is what remains after gross profit, operating expenses, interest, and taxes. Net margin shows the true profitability of your business model.
Understanding the Relationship
Scenario 1: Good gross, good net (top-quartile performance)
A $50M machinery manufacturer:
- Gross margin: 34%
- Operating expenses: 18% of revenue
- Interest and taxes: 4% of revenue
- Net margin: 12%
This manufacturer has both good product margins and efficient operations. The 34% gross margin provides enough buffer to cover operating expenses and still deliver 12% net margin.
Scenario 2: Good gross, poor net (operational inefficiency)
A $30M plastics manufacturer:
- Gross margin: 32%
- Operating expenses: 24% of revenue
- Interest and taxes: 4% of revenue
- Net margin: 4%
Product margins are strong, but bloated operating expenses consume the profit. This manufacturer needs to reduce SG&A costs, not improve production efficiency. The problem is in business operations, not on the factory floor.
Scenario 3: Poor gross, good net (commodity efficiency)
A $60M auto parts manufacturer:
- Gross margin: 18%
- Operating expenses: 10% of revenue
- Interest and taxes: 2% of revenue
- Net margin: 6%
Thin product margins are offset by extremely tight operational control. This works for commodity manufacturers who compete on cost. It's not sustainable for manufacturers needing to invest in R&D, engineering, or sales resources.
Scenario 4: Poor gross, poor net (needs immediate action)
A $25M food processor:
- Gross margin: 20%
- Operating expenses: 14% of revenue
- Interest and taxes: 3% of revenue
- Net margin: 3%
Both product profitability and operational efficiency are below target. This requires immediate action on multiple fronts: pricing, material costs, production efficiency, and operating expense control.
Why This Matters for Manufacturers
According to Unleashed Software's profitability guide, understanding the relationship between gross and net margins reveals where to focus improvement:
- If gross margin is good but net margin is poor: Focus on operating expense reduction, not production efficiency
- If gross margin is poor but net margin is acceptable: You have efficient operations but thin product margins—pricing may be the issue
- If both are poor: Address pricing, COGS, and operating expenses simultaneously
What Drives Good Manufacturing Net Profit Margins
Five factors separate manufacturers with good net margins from those with average or poor margins:
1. Pricing Discipline
According to McKinsey's 2003 study "The Power of Pricing" published in McKinsey Quarterly, a 1% price improvement drives an 8% increase in operating profit for B2B companies. For a manufacturer running 10% net margin, that 1% price improvement boosts profit by 10%.
Manufacturers with good net margins implement:
Systematic cost pass-through. Material cost increases trigger price reviews within 30 days and customer notifications within 60 days. Pass-through lag is measured and managed. A manufacturer taking 6 months to pass through a 5% material increase loses margin for half a year.
Value-based pricing for differentiated products. Cost-plus pricing is used only for commodity items. Engineered solutions, custom work, and technical products are priced based on customer value delivered, not internal costs.
Minimum margin guardrails. Floor margins are defined by product category. Exceptions require VP approval and are tracked monthly. High exception rates trigger discount policy reviews and sales incentive changes.
Quote discipline and win rate analysis. Win rates are tracked by discount level. A $35M manufacturer found minimal win rate improvement from discounting—31% at full price versus 34% with 10%+ discount. They stopped discounting and recovered 3.2 points of net margin.
2. Operating Expense Control
Net margin is where gross margin goes to die if operating expenses aren't controlled. Manufacturers with good net margins manage SG&A as rigorously as COGS.
SG&A targets as percentage of revenue. Operating expenses are benchmarked by function (sales, marketing, admin, facilities). Performance is tracked monthly against target percentages. Expense growth is held below revenue growth.
Zero-based approach to indirect spend. Every dollar of overhead is justified annually. A $42M manufacturer implemented zero-based budgeting for indirect costs and reduced SG&A from 21% to 17% of revenue over 18 months, improving net margin from 8% to 12%.
Overhead allocation to products. Manufacturing overhead is allocated based on actual consumption (machine hours, setups, material handling). This reveals true product profitability and prevents high-volume products from subsidizing low-volume items.
Automation and technology ROI. Capital investments require clear payback calculations using fully-loaded costs. Projects with less than 3-year payback are prioritized. Technology spending must demonstrably reduce costs or increase capacity.
3. COGS Management
Manufacturers spend 42% of revenue on materials on average. A 3% reduction in material costs improves net margin by roughly 1.3 percentage points—if you can hold the savings.
Strategic sourcing and supplier management. Competitive bidding, volume consolidation, alternative materials, and geographic sourcing reduce costs. A $48M manufacturer reduced material costs 4.1% through supplier negotiations and spec changes, adding 1.7 points to net margin.
Scrap and rework reduction. Every point of scrap directly reduces margin. A plastics manufacturer reduced scrap from 5.8% to 2.1% by implementing statistical process control and fixing root causes. This improved net margin by 2.8 points.
Labor productivity improvement. For labor-intensive manufacturers, productivity gains drop directly to margin. Output per direct labor hour should improve 3-5% annually through methods optimization, tooling, and training.
Capacity utilization optimization. Running at 85%+ capacity spreads fixed costs over more units. A manufacturer running 68% utilization added contract work at 25% gross margin to cover fixed overhead, improving overall net margin from 9% to 12%.
4. Product Portfolio Management
Not all products generate the same margin. Manufacturers with good net margins actively steer mix toward profitable items.
SKU rationalization analysis. Review typically reveals 20-30% of SKUs generate minimal or negative contribution margin after accounting for cost-to-serve. A $38M manufacturer discontinued 580 SKUs (22% of catalog) over 12 months, shifting capacity to profitable products and improving net margin from 9% to 13%.
Mix optimization through incentives. Sales compensation and quoting guidance steer volume toward higher-margin products. Product line reviews happen quarterly, not annually.
New product introduction discipline. New products launch only when target margins are achievable. Products that can't meet minimum margin thresholds don't go to market or are redesigned.
5. Customer Profitability Management
Good net margins come from serving the right customers at the right price. Customer-level profitability reveals which relationships drive results.
Calculate true customer profitability. Revenue, COGS, and cost-to-serve (freight, rebates, service, financing terms) by customer. This shows which relationships are truly profitable.
Price services separately. Engineering support, expedited delivery, custom packaging, consignment inventory, and technical service are priced separately. Bundled pricing gives away margin.
Remediate unprofitable customers. Customers below minimum margin thresholds are repriced, renegotiated, or exited. A $52M manufacturer found 65 customers (19% of count, 12% of revenue) producing negative pocket margin after freight and service costs. Repricing these accounts recovered 2.1 points of net margin.
How to Calculate Your Net Profit Margin
Net profit margin is calculated from your income statement:
Net Profit Margin = (Net Profit / Revenue) × 100Step-by-step calculation:
- Start with revenue (top line)
- Subtract COGS to get gross profit
- Subtract operating expenses to get operating profit
- Subtract interest expense
- Subtract taxes
- Result is net profit (bottom line)
- Divide net profit by revenue and multiply by 100
Example: $10M manufacturer
| Line Item | Amount |
|---|---|
| Revenue | $10,000,000 |
| COGS | $6,500,000 |
| Gross Profit | $3,500,000 (35% margin) |
| Operating Expenses | $2,000,000 |
| Operating Profit | $1,500,000 (15% margin) |
| Interest Expense | $300,000 |
| Profit Before Tax | $1,200,000 |
| Income Tax (25%) | $300,000 |
| Net Profit | $900,000 |
Net Profit Margin = ($900,000 / $10,000,000) × 100 = 9%This manufacturer has good gross margin (35%) and healthy operating margin (15%), but net margin is pulled down to 9% by interest expense and taxes. The 9% is acceptable but below the 10-15% target for general manufacturing. Reducing debt would improve net margin by converting more operating profit to net profit.
How Manufacturers Achieve Good Net Profit Margins
Moving from average to good net margins requires systematic improvement across pricing, operations, and cost management:
Pricing Improvements
Implement value-based pricing for differentiated work. A precision manufacturer saving customers $150K annually in quality costs and downtime priced on value, not cost-plus 20%. Net margin improved from 11% to 16% on those applications.
Create systematic cost pass-through processes. Monthly material cost tracking with 5% change triggers for price reviews. Customer increases communicated with data showing input cost changes. Pass-through lag reduced from 5 months to 2 months, recovering 1.8 points of net margin.
Enforce minimum margin thresholds with approval workflows. Define floor net margins by product category (commodity 8%, standard 12%, custom 15%). Require VP approval for exceptions. Track exceptions quarterly. Exception rates dropped from 38% of orders to 12%, improving blended net margin.
Price services separately from products. Engineering support ($150/hr), rush orders (+15%), custom packaging (cost + 20%), inventory management programs (0.8% of annual volume). Unbundling services recovered 1.2 points of net margin.
Operational Improvements
Control SG&A growth below revenue growth. Set operating expense targets as percentage of revenue by function. A manufacturer held SG&A growth to 3% annually while revenue grew 8%, reducing SG&A from 19% to 16% of revenue and improving net margin by 3 points.
Optimize capacity utilization to spread fixed costs. Fill unused capacity with profitable volume through adjacent markets, contract manufacturing, or new applications. A machinery manufacturer running 68% utilization added contract work at 28% gross margin, covering fixed overhead and improving net margin from 9% to 13%.
Attack scrap and waste systematically. Track by type, source, and cost. Focus on vital few causes. A manufacturer reduced scrap from 6.1% to 2.3% through process controls and mold improvements, improving net margin by 2.4 points.
Rationalize unprofitable SKUs to free capacity. Identify products below minimum margin thresholds. Discontinue, reprice, or redesign. A $42M manufacturer cut 640 SKUs (28% of catalog) generating 4% of revenue and negative contribution. Net margin improved by 2.8 points.
Cost Management
Reduce material costs through strategic sourcing. Supplier negotiations, volume consolidation, alternative materials, geographic sourcing options. A $35M manufacturer reduced material costs 4.2% through competitive bidding, adding 1.8 points to net margin.
Implement overhead allocation to reveal true costs. Allocate manufacturing overhead based on actual consumption (machine hours, setups, handling). This reveals which products truly generate profit after all costs. Manufacturers often find 15-25% of products are marginally profitable or losing money.
Manage working capital to reduce financing costs. Every point of improvement in cash conversion cycle reduces interest expense. A manufacturer reduced inventory turns from 4.5x to 6.2x and cut DSO from 65 to 52 days, reducing debt and interest expense by $140K annually—adding 1.4 points to net margin.
See our complete guide to improving profit margins for detailed strategies and our margin analysis guide for identifying improvement opportunities.
Is Your Net Profit Margin Good Enough?
Knowing whether your net profit margin is "good" compared to industry targets provides useful context. The more actionable question is: what's preventing you from achieving good net margins?
Most manufacturers have margin improvement opportunities hiding in transaction data:
- Customer-specific pricing that hasn't been reviewed in years
- Cost increases not fully passed through to customers
- Product mix drift toward lower-margin items
- High-touch service provided to low-margin accounts
- Discounts that were supposed to be temporary but became permanent
- SKUs consuming capacity while generating minimal or negative margin
- Freight and rebate costs not tracked at transaction level
Finding these opportunities requires analyzing transactions at product, customer, and time-period level. For manufacturers with thousands of SKUs and hundreds of customers, Excel becomes unwieldy.
That's what Pryse is built for. Upload your transaction data and see exactly where your net margin is going—and where it could be better—in 24 hours, not 6 months.
For more on manufacturing profitability, see our guides on what is a good profit margin for manufacturing, average manufacturing profit margins, average manufacturing gross margins, and complete profit margin benchmarks by industry.
Sources:
- What is a Good Net Profit Margin? The 2026 Benchmarks - TrueProfit
- Industry Benchmarks of Gross, Net and Operating Profit Margins - Vena Solutions
- Profit Margin by Industry - FullRatio
- Operating and Net Margins - NYU Stern
- What is a Good Profit Margin? Industry Averages & How to Improve - Unleashed Software
- The Power of Pricing - McKinsey Quarterly
Last updated: February 24, 2026
Frequently Asked Questions

Want to analyze your entire product catalog?
Pryse automatically identifies margin leakage across thousands of SKUs. Upload your data and find hidden profit in 24 hours.
One-time $1,499 diagnostic. No subscription required.