What Is a Good Profit Margin? Benchmarks for Distribution and Manufacturing
A good profit margin depends on your industry and margin type. See benchmarks for gross, net, and operating margins across distribution and manufacturing.
A good profit margin depends on which margin you're measuring and what industry you're in. For net profit margin, 10% to 20% is healthy for most businesses. For gross margin, 20% to 50% is typical. For operating margin, 8% to 15% is standard.
The question isn't whether your margin is "good" in absolute terms. The question is whether it's good for your industry, your cost structure, and your business model.
The Three Profit Margins You Need to Know
Before comparing your margin to benchmarks, clarify which margin you're measuring. Each margin type answers a different question:
Gross Margin (also called gross profit margin)
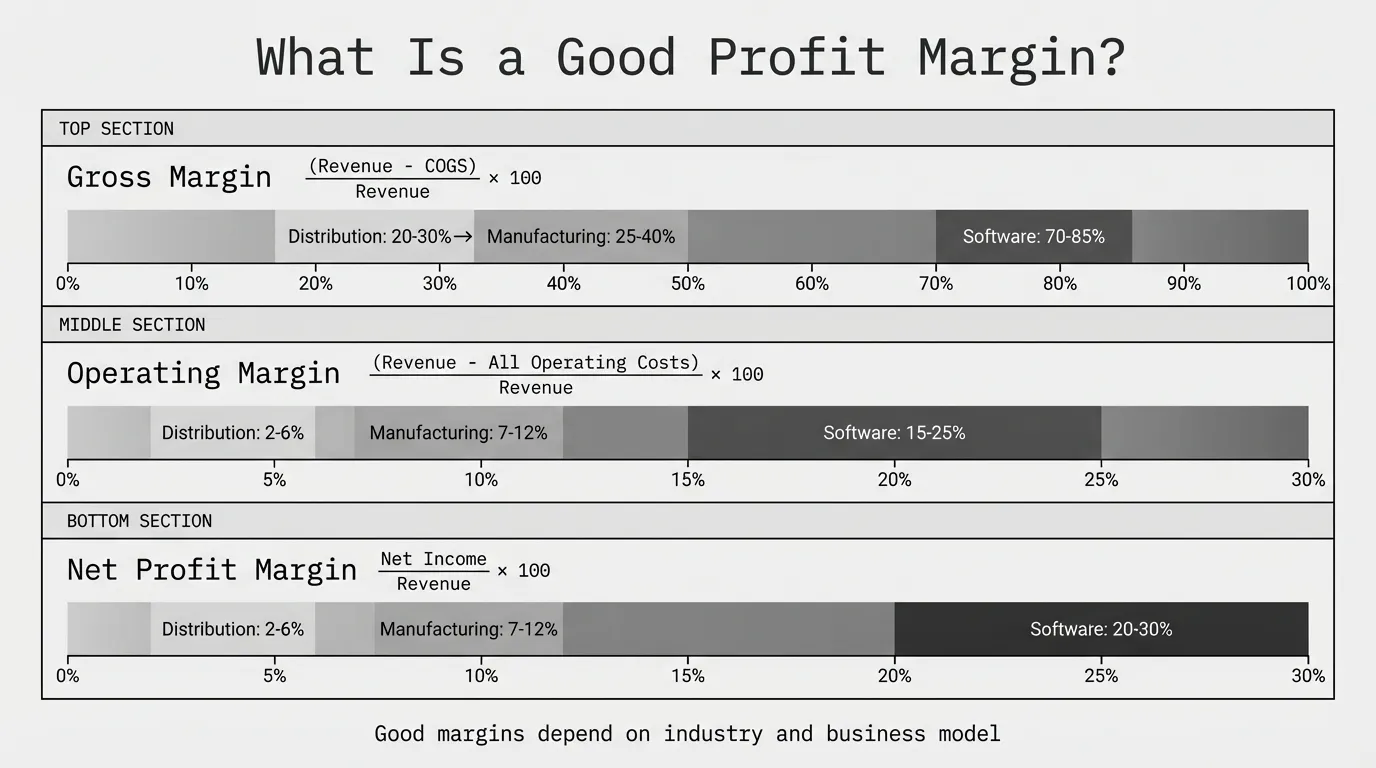
Gross Margin = (Revenue - COGS) / Revenue × 100This measures product profitability before operating expenses. It tells you whether your pricing and direct costs are healthy. Distribution companies average 20-30% gross margin. Manufacturing averages 25-40%.
Operating Margin
Operating Margin = (Revenue - COGS - Operating Expenses) / Revenue × 100This measures profitability after operating expenses (salaries, rent, marketing) but before interest and taxes. It tells you whether your business model works at current scale. Average operating margin across industries is 8-15%.
Net Profit Margin (or net margin)
Net Profit Margin = Net Income / Revenue × 100This measures bottom-line profitability after all expenses, interest, and taxes. It's the ultimate test of whether your business creates value. Average net margin ranges from 5% to 20% depending on industry.
When someone asks "what's your profit margin?" without specifying, they usually mean net profit margin. But each margin type reveals different insights. A company with strong gross margin (35%) and weak net margin (3%) has an operating expense problem, not a pricing problem.
Good Profit Margin Benchmarks by Industry
Profit margins vary dramatically across industries. A 10% net margin that's strong for a food distributor would be weak for a software company. Here's what the data shows:
| Industry | Gross Margin | Operating Margin | Net Margin | Source |
|---|---|---|---|---|
| SaaS / Software | 70-85% | 15-25% | 20-30% | Industry reports |
| Professional Services | 50-70% | 10-20% | 10-20% | Industry average |
| Machinery Manufacturing | 35-40% | 8-12% | 5-10% | NYU Stern |
| Industrial Distribution | 22-30% | 3-7% | 2-6% | McKinsey research |
| General Manufacturing | 25-35% | 7-12% | 5-10% | Industry average |
| Electronics Distribution | 25-30% | 3-6% | 2-5% | NYU Stern |
| Wholesale Distribution | 20-30% | 2-6% | 1-4% | Industry average |
| Auto Parts Distribution | 14-18% | 2-4% | 1-3% | NYU Stern |
| Food Wholesalers | 13-18% | 1-3% | 0.5-2% | NYU Stern |
Data compiled from NYU Stern's margin database and Vena Solutions industry benchmarking, updated January 2026.
The pattern is clear: industries with higher gross margins generally have higher net margins, but not proportionally. A software company with 75% gross margin might only achieve 20% net margin after sales, marketing, and R&D costs. A distributor with 25% gross margin might deliver 4% net margin with lean operations.
What's "Good" for Distribution Companies
Distribution operates on thin margins. You're buying products and reselling them without significant transformation. Your margin comes from efficiency, service value, and pricing discipline—not from creating proprietary products.
According to McKinsey's 2019 industrial distribution research, top-performing distributors ("legends") maintained EBITDA margins of 8-12%, while average distributors achieved 4-6%. This translates to net margins of roughly 2-4% for average distributors and 4-8% for elite performers.
Healthy profit margins for distributors:
- Gross margin: 20-30%
- Operating margin: 2-6%
- Net profit margin: 2-6%
More specifically by distribution type:
| Distribution Type | Gross Margin | Net Margin |
|---|---|---|
| Food/grocery distribution | 13-18% | 0.5-2% |
| Industrial distribution | 22-30% | 3-7% |
| Electrical distribution | 25-32% | 4-8% |
| Specialty/technical distribution | 28-38% | 5-10% |
For mid-market distributors in the $20M-$200M range, here's how to interpret your net profit margin:
| Your Net Margin | What It Means |
|---|---|
| Below 2% | High risk—no buffer for downturns or pricing errors |
| 2-4% | Acceptable for commodity distribution |
| 4-6% | Healthy for general distribution |
| 6-10% | Strong; indicates operational efficiency or pricing power |
| Above 10% | Excellent; usually requires specialization |
According to SPARXiQ's distributor benchmarking, average distributors achieve EBITDA of 4% while elite distributors reach 8-12%. The difference comes from pricing discipline, not from being in higher-margin product categories.
What's "Good" for Manufacturing Companies
Manufacturers have more margin variability than distributors because they create products. Your margin depends on product complexity, market position, scale, and vertical integration.
Manufacturing profit margins typically range from 7% to 12% for net margin, according to industry benchmarking data. But this masks significant variation:
Healthy profit margins for manufacturers:
- Gross margin: 25-40%
- Operating margin: 7-12%
- Net profit margin: 7-12%
More specifically by manufacturing type:
| Manufacturing Type | Gross Margin | Net Margin |
|---|---|---|
| Commodity manufacturing | 20-28% | 5-8% |
| General manufacturing | 25-35% | 7-12% |
| Industrial machinery | 32-40% | 8-15% |
| Specialty/custom manufacturing | 35-50% | 10-20% |
For mid-market manufacturers, here's how to interpret your net profit margin:
| Your Net Margin | What It Means |
|---|---|
| Below 5% | Commodity pricing pressure or cost structure issues |
| 5-8% | Acceptable for volume manufacturing |
| 8-12% | Healthy for most manufacturing |
| 12-18% | Strong; indicates differentiation or niche market |
| Above 18% | Excellent; usually requires proprietary technology |
A $75M industrial manufacturer operating at 9% net margin is performing well. The same margin at a specialty chemical manufacturer might signal problems, since specialty manufacturers typically command 12-18% margins.
Factors That Shift What's "Good" for Your Business
Industry benchmarks are starting points, not targets. Several factors push your "good" margin higher or lower:
Business Model Factors
Value-added services raise your margin ceiling. A distributor providing technical support, custom kitting, or inventory management should command higher margins than one just moving boxes. If you're at 4% net margin while offering significant value-adds, you're likely underpriced.
Private label or proprietary products push margins up. Distributing someone else's branded product means competing on price. Manufacturing your own means capturing more value. Companies with proprietary products typically achieve 2-5 percentage points higher net margins.
Scale compresses your "good" target. High-volume, low-touch operations can be profitable at 3% net margin. Low-volume, high-touch operations need 8%+ to cover costs.
Market Position Factors
Specialization commands premium margins. A general industrial distributor might hit 4% net margin. A specialty distributor serving aerospace or medical? 8-12%.
Geographic monopolies or oligopolies change the math. Limited competition in a region allows margin expansion beyond industry benchmarks. But this advantage erodes when new competitors enter.
Customer concentration matters. If 40% of revenue comes from three accounts who negotiated hard, your overall margin doesn't reflect your true pricing capability. Look at margin distribution by customer, not just the average.
Operational Factors
Operational efficiency directly impacts net margin. Two distributors with identical 25% gross margins can have very different net margins—one at 6% and one at 2%—based purely on operational efficiency. Inventory turns, labor productivity, warehouse layout, and technology all affect how much of your gross margin converts to net profit.
Growth stage affects what's acceptable. A company investing heavily in growth might accept 5% net margin temporarily. A mature company in a stable market should target 10%+.
Warning Signs Your Profit Margin Is Too Low
A below-benchmark profit margin usually points to specific problems:
1. Margin leakage through untracked discounting. Sales reps give away margin to close deals. Those discounts never get aggregated or analyzed. You think you're at 26% gross margin; you're actually at 21%. That 5-point gap shows up as depressed net margin.
2. Supplier cost increases not passed through. Your supplier costs went up 4% last year. Customer prices went up 2%. That's 2 points of margin erosion that compounds annually. Three years of this pattern destroys profitability.
3. Product mix drift. You're selling more low-margin items over time, either because sales pushes them or because customers demand them. Overall margin declines while no individual transaction looks bad. Check margin by product category over time.
4. Customer-specific pricing that outlived its purpose. A deal negotiated in 2019 for a major account is still active, even though their volume dropped 60%. Pricing rarely gets revisited unless customers complain.
5. Hidden cost absorption. You're eating freight, handling, restocking, and expedite costs that should be charged. These don't show up in COGS, so your gross margin looks fine while your net margin erodes.
6. Operational inefficiency. Your gross margin is healthy (28%) but your net margin is weak (3%). The problem isn't pricing—it's operating expense. Warehouse inefficiency, excessive headcount, or technology gaps eat the margin.
According to McKinsey's 2003 study "The Power of Pricing" published in McKinsey Quarterly, a 1% price improvement drives an 8% increase in operating profit for B2B companies. For distributors specifically, McKinsey's 2019 research found that a 1% price increase produces a 22% EBITDA increase when analyzing 130 distribution companies.
This means small margin losses compound dramatically. A 2% margin leak that seems minor actually represents a 16-44% reduction in profitability.
Warning Signs Your Profit Margin Is Too High
High margins aren't always good news:
1. You're leaving growth on the table. Margins above industry benchmark might mean you're pricing yourself out of market share you could profitably capture. A distributor at 10% net margin when competitors run at 5% might be sacrificing volume growth.
2. You're vulnerable to competition. Abnormally high margins attract competitors. If a new entrant can serve your customers at 6% net margin when you're at 12%, you'll feel pricing pressure quickly.
3. Customer satisfaction risk. Customers who feel overcharged eventually leave or demand renegotiation. High margins today can become retention problems tomorrow, especially if customers benchmark your pricing against alternatives.
4. You're not investing in growth. Some companies maintain high margins by underinvesting in sales, marketing, and product development. The margin looks great until growth stalls and competitors pass you.
That said, if you're genuinely differentiated with sticky customers and a defensible niche, high margins are appropriate. The warning applies when high margins come from neglect rather than value creation.
How to Compare Your Margin to Benchmarks
A single profit margin number doesn't tell you much. Here's how to make the comparison meaningful:
1. Calculate Margins Consistently
Make sure you're calculating margins the same way benchmarks do:
- Gross margin: Include product costs and inbound freight in COGS. Don't include warehouse labor for outbound shipping, sales costs, or overhead.
- Operating margin: Include all operating expenses (salaries, rent, marketing) but exclude interest and taxes.
- Net margin: Use net income after all expenses, interest, and taxes.
If your ERP or accounting system calculates margins differently, adjust before comparing to industry data.
2. Segment Your Analysis
Company-wide margin hides what's happening underneath. Calculate margin by:
- Product category: Which categories drag down the average?
- Customer segment: Are your biggest customers your most profitable?
- Sales channel: Does e-commerce have different margin than direct sales?
- Geography: Do different regions perform differently?
- Time period: Is margin trending up, down, or flat?
A 4% overall net margin might be masking 8% margin on specialty products and 1% margin on commodity items. The insight is in the segmentation.
3. Compare to Direct Competitors
Industry-wide benchmarks are useful context. But your direct competitors matter more. A food distributor shouldn't compare to a specialty electronics distributor, even though both are "distributors." Find 3-5 public companies in your specific vertical and analyze their reported margins.
4. Track Margin Trend, Not Just Level
A net profit margin that's declined from 7% to 3% over three years is more concerning than a stable 2%. Trend direction matters as much as absolute level.
If margin is declining, find out why before benchmarking. You might be solving the wrong problem.
The Relationship Between Margin Types
Gross margin, operating margin, and net profit margin tell a connected story. Here's how they relate:
- Gross margin shows whether your pricing and product costs are healthy
- Operating margin shows whether your business model works at current scale
- Net profit margin shows the bottom line after everything
A company with healthy gross margin (30%) but weak net margin (2%) has an operating expense problem. A company with weak gross margin (18%) and weak net margin (1%) has a pricing or COGS problem.
Example analysis for a $50M distributor:
| Scenario | Gross Margin | Operating Margin | Net Margin | Diagnosis |
|---|---|---|---|---|
| Company A | 28% | 6% | 4% | Healthy across all metrics |
| Company B | 28% | 2% | 1% | Operating expense problem—gross margin is fine |
| Company C | 18% | 3% | 2% | Pricing/COGS problem—margins compressed from the start |
| Company D | 35% | 8% | 6% | Strong performance—above-average margins |
This diagnostic approach tells you where to focus. Company B shouldn't waste time on pricing analysis—they need to address operating expenses. Company C needs to fix pricing or supplier costs.
Where Is Your Margin Going?
Knowing whether your profit margin is "good" is useful context. But the more actionable question is: where is margin leaking?
Most distribution and manufacturing companies have 3-7 percentage points of recoverable margin hiding in their transaction data. It's in:
- Discounts that were supposed to be one-time but became permanent
- Freight and handling charges that never got billed
- Customer-specific pricing that hasn't been reviewed in years
- Cost increases that weren't fully passed through
- Product mix shifts toward lower-margin items
- High-touch service provided to low-margin accounts
Finding this margin requires analyzing transactions at the line-item level across products, customers, and time periods. For companies with thousands of SKUs and hundreds of customers, Excel becomes unwieldy.
That's what Pryse is built for. Upload your transaction data and see where your margin actually goes in 24 hours, not 6 months.
For a deeper look at analyzing margins by segment, see our complete guide to profit margins by industry.
Last updated: February 24, 2026
Frequently Asked Questions

Want to analyze your entire product catalog?
Pryse automatically identifies margin leakage across thousands of SKUs. Upload your data and find hidden profit in 24 hours.
One-time $1,499 diagnostic. No subscription required.