Average Gross Profit Margin for Manufacturing: Industry Benchmarks by Sector
The average gross margin for manufacturing is 25-35%. See detailed benchmarks for machinery, chemicals, food processing, metal fabrication, and other sectors.
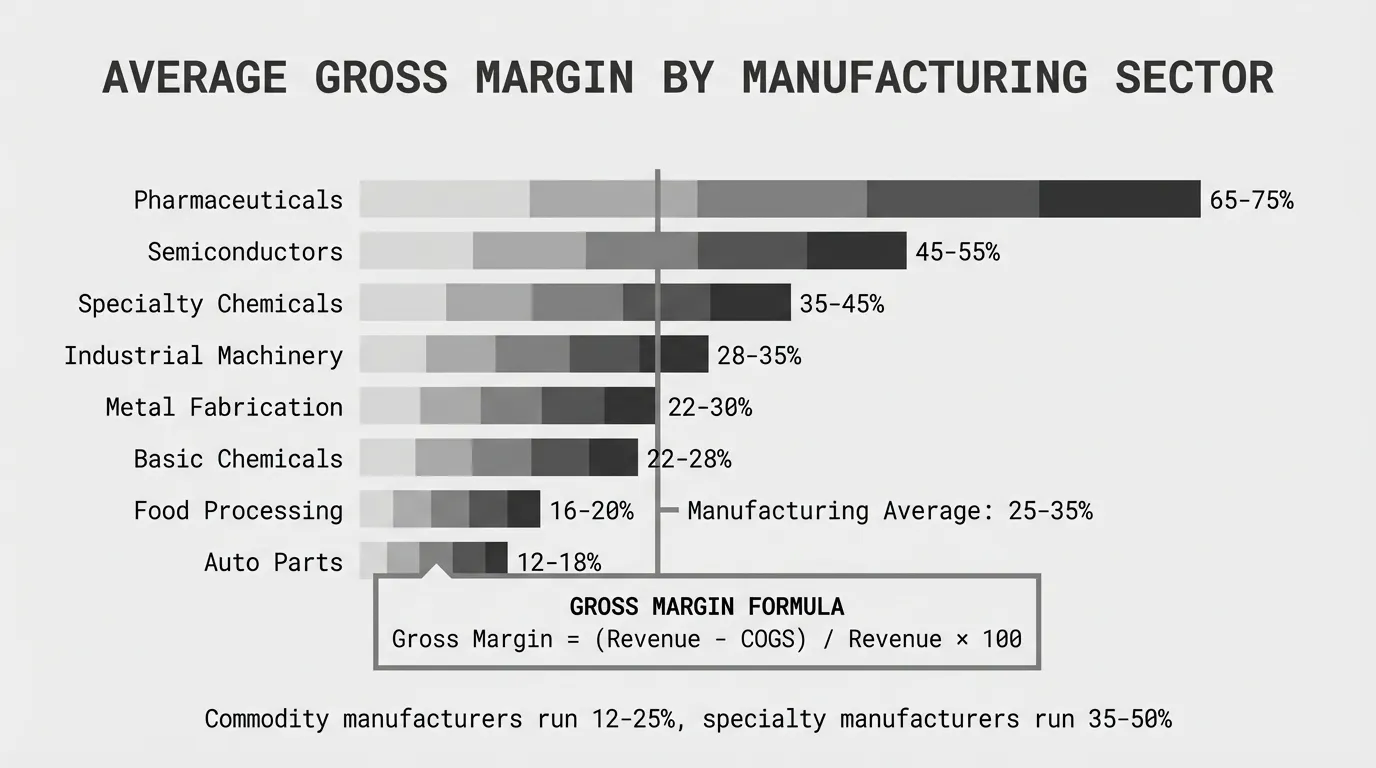
The average gross profit margin for manufacturing is 25-35%. But this hides massive variation. Auto parts manufacturers run 12-18% gross margin. Specialty chemical manufacturers reach 35-50%. Industrial machinery sits in the middle at 28-35%.
Product type, differentiation level, and material costs explain most of the difference. Commodity manufacturers with price-driven competition operate at the low end. Specialty manufacturers with proprietary products or technical expertise command the high end.
What Is Gross Profit Margin in Manufacturing?
Gross profit margin (or gross margin) measures product profitability before operating expenses. It shows how much you keep from each revenue dollar after paying for what it costs to make the product.
Gross Margin = (Revenue - COGS) / Revenue × 100For manufacturers, COGS includes:
- Raw materials and purchased components
- Direct production labor (workers on the factory floor)
- Manufacturing overhead (factory rent, equipment depreciation, utilities, maintenance)
A manufacturer with $10M revenue and $6.5M COGS has a gross margin of 35%:
($10M - $6.5M) / $10M × 100 = 35%Gross margin is different from net profit margin. Net profit margin accounts for all expenses including sales, admin, interest, and taxes. Manufacturing companies typically achieve 25-35% gross margin but 7-12% net margin, because operating expenses consume much of the gross profit.
According to Vena Solutions' industry benchmarking data, manufacturers normally aim for 25-35% gross margins, which reflect production efficiency and raw material costs.
Average Gross Margin for Manufacturing by Sector
Manufacturing isn't one industry. A semiconductor fabricator has nothing in common with a food processing plant. Gross margins vary dramatically by sector:
| Manufacturing Sector | Gross Margin | Material Costs | Differentiation Level |
|---|---|---|---|
| Auto Parts | 12-18% | Very High | Low - commodity |
| Food Processing | 16-20% | High | Low - commodity |
| Basic Chemicals | 22-28% | High | Low - commodity |
| Plastics & Rubber | 22-30% | Moderate-High | Low-Moderate |
| Metal Fabrication | 22-30% | Moderate | Low-Moderate |
| Electrical Equipment | 28-35% | Moderate | Moderate |
| Industrial Machinery | 28-35% | Moderate | Moderate-High |
| Specialty Chemicals | 35-45% | Low-Moderate | High |
| Semiconductors | 45-55% | Low | Very High |
| Apparel Manufacturing | 50-55% | Moderate | Moderate-High |
| Pharmaceuticals | 65-75% | Very Low | Very High |
Data compiled from NYU Stern's margin database (updated January 2026), CSI Market industry data, and Vena Solutions benchmarking.
The pattern is clear: sectors producing standardized, commodity products operate at 12-25% gross margin. Sectors producing differentiated or technically complex products command 35-75% gross margin.
Auto Parts Manufacturing Gross Margins
Auto parts manufacturing shows some of the lowest gross margins in manufacturing. Auto and truck parts manufacturing operates with gross margins around 12-18%, according to industry data.
Why margins are thin:
- Intense pricing pressure from large OEMs (Ford, GM, Toyota)
- Commodity-like products with limited differentiation
- High tooling costs and capital intensity
- Material cost volatility (steel, aluminum, resins)
- Volume-based contracts with tight price targets
A $30M stamping manufacturer producing brackets and housings for Tier 1 suppliers might achieve 15% gross margin. The business competes almost entirely on price, quality, and delivery. Winning a contract requires investment in specific tooling that's only useful for that customer and part.
If material costs increase 4%, manufacturers often can't pass through the full increase due to long-term contract pricing. That cost absorption erodes already-thin gross margins.
Food Processing Gross Margins
Food processing and manufacturing operates with gross margins of 16-20% for most sectors. According to CSI Market's food processing industry data, gross margins averaged around 19% in recent quarters.
Food manufacturers' gross margins are constrained but not as tight as auto parts. Material costs (ingredients) typically represent 55-65% of revenue, leaving 35-45% gross profit dollars. But high spoilage, refrigeration, logistics, and compliance costs consume much of that, resulting in net margins of just 4-7%.
Why gross margins are moderate but net margins are thin:
- High raw material costs (commodities with volatile pricing)
- Short shelf life creates spoilage and waste
- Refrigeration and cold chain requirements
- Regulatory compliance costs (FDA, USDA inspections)
- Price sensitivity from retailers and consumers
- Limited ability to differentiate basic products
A $50M regional food processor making frozen vegetables might run 18% gross margin. The product requires controlled-environment processing, blast freezing, cold storage, and refrigerated transport. By the time operating expenses are deducted, net margin is 4-5%.
Specialty food manufacturers with branded products can reach 25-30% gross margins. A producer of organic sauces sold at premium retailers operates at higher gross margins than a contract manufacturer making store-brand frozen foods.
Industrial Machinery Gross Margins
Industrial machinery manufacturing achieves gross margins of 28-35%, placing it in the middle-to-upper range of manufacturing. The sector benefits from product complexity and engineering value that commodity manufacturers can't capture.
Why gross margins are moderate to strong:
- Custom engineering and application-specific design
- Technical complexity creates barriers to competition
- Aftermarket parts and service revenue streams
- Customer switching costs (integration, training, downtime)
- Longer sales cycles with negotiated pricing
A $75M industrial equipment manufacturer producing conveyor systems for manufacturing plants might run 32% gross margin. Each system requires engineering, custom design, and application knowledge. The customer can't easily switch to a competitor because systems are integrated into their facility.
Material costs for machinery manufacturers typically represent 45-55% of revenue, lower than food processing or auto parts. Labor and engineering represent a larger share, but these can be priced at higher rates when selling complex, differentiated products.
Chemical Manufacturing Gross Margins
Chemical manufacturing shows a wide spread based on product type:
Basic Chemicals: 22-28% gross margin
- Commodity chemicals (sulfuric acid, chlorine, ammonia)
- Price-driven competition
- Large-scale production with economies of scale
- High capital requirements and fixed costs
- Cyclical demand tied to industrial activity
A $100M basic chemicals manufacturer producing industrial solvents operates at 25% gross margin. Products are standardized. Customers buy on price and delivery. The only competitive advantage is being the low-cost producer at scale.
Specialty Chemicals: 35-45% gross margin
- Application-specific formulations
- Technical sales and customer collaboration
- Smaller volumes but higher margins
- Intellectual property and proprietary processes
- Customer switching costs (qualification, testing)
A $40M specialty chemicals company producing custom coatings for aerospace applications runs 42% gross margin. Products require technical expertise, regulatory approvals, and customer qualification. Once qualified, customers rarely switch suppliers because requalification is expensive and risky.
According to NYU Stern's sector margin data, chemical manufacturing margins vary significantly based on whether the company produces commodity or specialty products.
Metal Fabrication Gross Margins
Metal fabrication (stamping, machining, welding, forming) typically achieves gross margins of 22-30%. This sector sits between commodity auto parts and differentiated machinery.
Standard fabrication: 22-26% gross margin
- Price-based competition for standard parts
- Purchased materials represent 50-60% of revenue
- Labor and machine time are the main value-adds
- Limited switching costs for customers
Precision/specialty fabrication: 28-35% gross margin
- Tight tolerances and complex geometries
- Material certifications and traceability requirements
- Technical capabilities (5-axis machining, exotic materials)
- Customer qualification barriers
A $25M job shop doing general metal fabrication for construction equipment runs 24% gross margin. They quote competitively on standard parts where three other shops can do the same work.
A $30M precision machining company serving medical device and aerospace markets runs 32% gross margin. Tight tolerances (±0.0005"), material certifications, and regulatory requirements create barriers. Qualification takes 6-12 months, so customers stick with proven suppliers.
Semiconductor and High-Tech Manufacturing Margins
Semiconductor manufacturing achieves gross margins of 45-55%, among the highest in manufacturing. This reflects massive capital intensity, technical barriers, and intellectual property.
Why gross margins are strong:
- Extreme capital requirements ($10B+ for leading-edge fabs)
- Technical complexity creates oligopoly dynamics
- High value-add relative to material costs
- Economies of scale favor large producers
- Intellectual property and process knowledge
A semiconductor manufacturer's material costs (silicon wafers, gases, chemicals) might be 15-25% of revenue. The remaining COGS is depreciation on fabrication equipment, clean room facilities, and highly skilled technical labor. Gross margin of 50% reflects the value captured from technical capability, not low production costs.
Apparel manufacturing also achieves high gross margins (50-55%) for branded products, though for different reasons. Material costs are moderate (30-40% of revenue), and labor costs vary by geography. Brand value and design intellectual property drive the margin.
Pharmaceutical Manufacturing Gross Margins
Pharmaceutical manufacturing shows the highest gross margins in manufacturing: 65-75%. This extreme margin reflects intellectual property, regulatory barriers, and minimal material costs.
Why gross margins are extreme:
- Patents create temporary monopolies
- Material costs are tiny relative to selling price
- Regulatory approval barriers prevent competition
- R&D costs are sunk by the time manufacturing starts
- Customers (patients) have limited price sensitivity
Material costs for a pharmaceutical product might be $2 per unit while the selling price is $100. Gross margin of 98% on that individual product. Blended across a portfolio with generics and older drugs, overall gross margin settles at 65-75%.
But pharmaceutical manufacturing isn't necessarily more profitable than other sectors. Massive R&D expenses (15-20% of revenue) consume much of the gross margin. Net margins end up at 20-30%—strong, but not proportional to the 70% gross margin.
Commodity vs. Specialty Manufacturing Margins
The biggest gross margin difference in manufacturing isn't sector-specific. It's whether you make commodity products or specialty products.
Commodity Manufacturing
- Gross margin: 12-25%
- Products: Standardized items where customers can easily switch suppliers
- Examples: Standard fasteners, commodity chemicals, basic metal stampings, food ingredients
- Competition: Price-driven
- Volume: High
- Strategy: Be the low-cost producer through scale and efficiency
A $40M fastener manufacturer producing standard bolts achieves 20% gross margin. Material costs are 65% of revenue. Direct labor is 8%. Manufacturing overhead is 7%. That leaves 20% gross margin. Net margin after operating expenses is 5%.
Specialty Manufacturing
- Gross margin: 35-50%
- Products: Differentiated items with technical barriers, IP, or unique capabilities
- Examples: Medical devices, aerospace components, specialty chemicals, precision instruments
- Competition: Value-driven
- Volume: Moderate to low
- Strategy: Differentiate through technical capability, quality, or customer intimacy
A $30M precision component manufacturer serving aerospace and defense markets runs 45% gross margin. Material costs are 40% of revenue. But those materials include titanium alloys, Inconel, and other exotic metals purchased in small quantities. Direct labor is 10% (highly skilled machinists). Manufacturing overhead is 5% (precision equipment depreciation). That leaves 45% gross margin. Net margin is 12%.
The gross margin gap isn't about working harder. It's about competitive dynamics and pricing power.
What Drives Manufacturing Gross Margins
Four factors explain most gross margin variation across manufacturers:
1. Material Costs as Percentage of Revenue
Material costs directly determine gross margin ceiling. If raw materials consume 60% of revenue, gross margin can't exceed 40% before accounting for any labor or overhead.
| Material Cost % | Maximum Possible Gross Margin | Typical Sector |
|---|---|---|
| 30-40% | 60-70% | Pharmaceuticals, software-enabled hardware |
| 40-50% | 50-60% | Machinery, electrical equipment |
| 50-60% | 40-50% | Metal fabrication, plastics |
| 60-70% | 30-40% | Food processing, basic chemicals |
| 70-80% | 20-30% | Auto parts, commodity manufacturing |
A manufacturer spending 65% of revenue on materials needs exceptional efficiency in labor and overhead to reach 30% gross margin. A manufacturer spending 40% on materials can reach 50% gross margin with moderate labor and overhead costs.
2. Product Differentiation Level
Commodity products command cost-plus pricing. Differentiated products command value-based pricing.
Commodity pricing: Customer chooses based on price. Your price must match or undercut competitors. Gross margin compresses to the minimum needed for the most efficient producer to stay in business.
Differentiated pricing: Customer chooses based on value delivered. You can price based on what the product is worth to the customer, not just what it costs you to make. Gross margin reflects value captured.
A metal stamping company making standard brackets competes with five other shops. Pricing is cost-plus 18-22%. Gross margin is 22%.
A metal stamping company making Class A automotive exterior panels requiring specialized tooling, tight tolerances, and surface finish specifications prices based on customer's switching costs and qualification barriers. Gross margin is 35%.
Same processes. Different products. Different competitive dynamics. Different margins.
3. Labor Efficiency and Automation Level
Direct labor as a percentage of COGS varies by automation:
| Manufacturing Type | Direct Labor % of COGS | Impact on Gross Margin |
|---|---|---|
| Highly automated | 5-10% | Minimal—efficiency gains are small |
| Semi-automated | 15-25% | Moderate—efficiency matters |
| Labor-intensive | 30-50% | High—efficiency is critical |
For highly automated manufacturers, labor is already optimized. Gross margin gains come from material costs or pricing. For labor-intensive manufacturers, productivity directly impacts gross margin.
A furniture manufacturer running 35% direct labor as a percentage of COGS sees immediate gross margin impact from efficiency gains. Increasing output per worker from 12 units/day to 15 units/day reduces labor cost per unit by 20%, improving gross margin by 7 percentage points.
4. Scale and Capacity Utilization
Manufacturing has high fixed costs. Gross margin improves as fixed manufacturing overhead spreads over more units.
A manufacturer with $2M in annual factory overhead (rent, equipment depreciation, maintenance) producing at different volumes:
| Capacity Utilization | Units Produced | Fixed Overhead per Unit | Impact on Gross Margin |
|---|---|---|---|
| 50% | 500,000 | $4.00 | Gross margin: 28% |
| 75% | 750,000 | $2.67 | Gross margin: 32% |
| 90% | 900,000 | $2.22 | Gross margin: 34% |
Fixed overhead per unit at 50%: $2,000,000 / 500,000 = $4.00
Fixed overhead per unit at 90%: $2,000,000 / 900,000 = $2.22
Margin improvement: 6 percentage points
On a product with $25 revenue and $15 variable costs, reducing fixed cost per unit from $4.00 to $2.22 increases gross margin from 28% to 34%.
Manufacturers operating below 70% capacity have margin improvement opportunities through volume growth without adding fixed costs.
How to Calculate Your Manufacturing Gross Margin
Calculate gross margin consistently to benchmark against industry data:
Gross Margin = (Revenue - COGS) / Revenue × 100What to include in COGS:
- Raw materials and purchased components (at delivered cost)
- Direct production labor (wages + benefits for factory workers)
- Manufacturing overhead (factory rent, utilities, equipment depreciation, maintenance, factory supplies, quality control labor)
What NOT to include in COGS:
- Sales commissions and marketing costs
- Administrative salaries (accounting, HR, executive)
- Office rent and non-production facilities
- R&D expenses (unless you capitalize them, then amortize into COGS)
- Shipping and logistics to customers (this is operating expense)
Example: $12M manufacturer
Revenue: $12,000,000
COGS breakdown:
- Raw materials: $4,800,000 (40%)
- Direct labor: $1,800,000 (15%)
- Manufacturing overhead: $1,200,000 (10%)
- Total COGS: $7,800,000 (65%)
Gross Margin = ($12M - $7.8M) / $12M × 100 = 35%This 35% gross margin is healthy for general manufacturing. After deducting $2.4M in operating expenses (sales, admin, facilities), operating margin is 15%. After interest and taxes, net margin is 10%.
Comparing Your Gross Margin to Benchmarks
A single gross margin number doesn't tell you much. Here's how to make the comparison meaningful:
1. Use the Right Benchmark
Don't compare a food processor to a pharmaceutical manufacturer. Both are "manufacturing" but operate in completely different environments.
Compare to:
- Direct competitors in your specific sub-sector
- Companies at similar scale ($20M vs. $500M matters)
- Similar product complexity (commodity vs. specialty)
- Similar business model (job shop vs. production runs)
2. Segment Your Gross Margin Analysis
Company-wide gross margin hides what's happening underneath. Calculate gross margin by:
- Product category: Which categories perform better?
- Customer segment: Do OEM customers have different margins than aftermarket?
- Production method: Cast vs. machined vs. fabricated
- Order type: Production runs vs. custom orders vs. rush orders
A 30% overall gross margin might hide 42% on specialty products and 18% on commodity items. The insight is in the segmentation.
3. Track Trend, Not Just Level
A gross margin that declined from 35% to 28% over two years is concerning even if 28% seems acceptable. Trend direction matters as much as absolute level.
Common causes of gross margin erosion:
- Material cost increases not passed through to customers
- Product mix shift toward lower-margin items
- Competitive pricing pressure on core products
- Inefficiency in production (scrap, rework, downtime)
- Volume decline spreading fixed overhead over fewer units
4. Understand the Margin Bridge
If your gross margin is below benchmark, identify where the gap comes from:
Your company: 24% gross margin Industry benchmark: 30% gross margin Gap to explain: 6 percentage points
Break down the gap:
- Material costs 3 points higher than benchmark (58% vs. 55%)
- Labor costs 2 points higher (inefficiency or smaller scale)
- Overhead costs 1 point higher (lower utilization)
Now you know where to focus improvement efforts.
How Manufacturers Can Improve Gross Margins
Gross margin improvement comes from either getting more revenue for what you sell (pricing) or spending less to make it (costs).
Pricing Strategies to Improve Gross Margin
Implement systematic pass-through of material cost increases. Material costs change constantly. Manufacturers who track changes and adjust prices maintain gross margins. Those who absorb increases erode them.
Create a monthly process: track key input costs, set thresholds triggering price reviews (5% change = review), communicate increases to customers with supporting data.
Price differentiated products on value, not cost-plus. An engineered solution saving a customer $100K annually is worth more than cost-plus 30%. Value-based pricing captures margin that cost-plus leaves on the table.
Separate pricing for engineering, tooling, and services. Design work, tooling investment, technical support, and quality documentation all have value. Pricing them separately (or tracking them distinctly) prevents margin leakage from "included" services.
Establish minimum margin guardrails by product type. Define floor margins by category. Require approval for exceptions. Track exception patterns. A manufacturer allowing 40 "exception" deals per quarter at below-target margins has a pricing discipline problem.
Cost Strategies to Improve Gross Margin
Reduce material costs through sourcing. A 3% reduction in material costs at 55% material content improves gross margin by 1.65 percentage points. Tactics include supplier negotiation, volume consolidation, alternative materials, and geographic sourcing evaluation.
Optimize capacity utilization. Fill unused capacity with profitable volume. This might mean entering adjacent markets, contract manufacturing services, or new customer segments. Fixed manufacturing overhead per unit drops as volume increases.
Attack scrap and rework root causes. Track defects by type and source. Apply 80/20 rule to find the vital few causes driving most waste. A $22M plastics manufacturer reduced scrap from 5.2% to 2.8% by fixing three mold issues, improving gross margin by 1.3 points.
Automate where ROI justifies it. Calculate payback using fully-loaded labor costs including benefits, turnover, training, and supervision. A $180K automation investment replacing $75K annual labor cost pays back in 2.4 years.
Improve labor efficiency through methods optimization. For labor-intensive manufacturers, productivity directly impacts gross margin. A production line running 85 units per hour versus 100 units per hour has 15% higher labor cost per unit.
See our complete guide to margin analysis for detailed methods on product profitability analysis and manufacturing profit margin guide for net margin improvement strategies.
Where Is Your Manufacturing Gross Margin Going?
Knowing whether your gross margin is "good" compared to industry average is useful context. The more actionable question is: where is your gross margin leaking?
Most manufacturers have 3-7 percentage points of gross margin erosion hiding in transaction data:
- Cost increases not passed through to customers
- Product mix shifts toward lower-margin items
- Customer-specific pricing that hasn't been reviewed in years
- Material waste and scrap from process inefficiency
- Untracked rework consuming labor and materials
Finding this margin requires analyzing transactions at the product, customer, and time-period level. For manufacturers with thousands of SKUs and hundreds of customers, Excel becomes unwieldy.
That's what Pryse is built for. Upload your transaction data and see exactly where your gross margin is going in 24 hours, not 6 months.
For more manufacturing margin strategies, see our complete guide to profit margins by industry and manufacturer profit margin benchmarks.
Last updated: February 24, 2026
Frequently Asked Questions

Want to analyze your entire product catalog?
Pryse automatically identifies margin leakage across thousands of SKUs. Upload your data and find hidden profit in 24 hours.
One-time $1,499 diagnostic. No subscription required.