What Is a Good Profit Margin for Manufacturing? Industry Benchmarks & Targets
A good profit margin for manufacturing is 10-20% net and 28-40% gross. See specific targets by sector, company size, and product differentiation level.
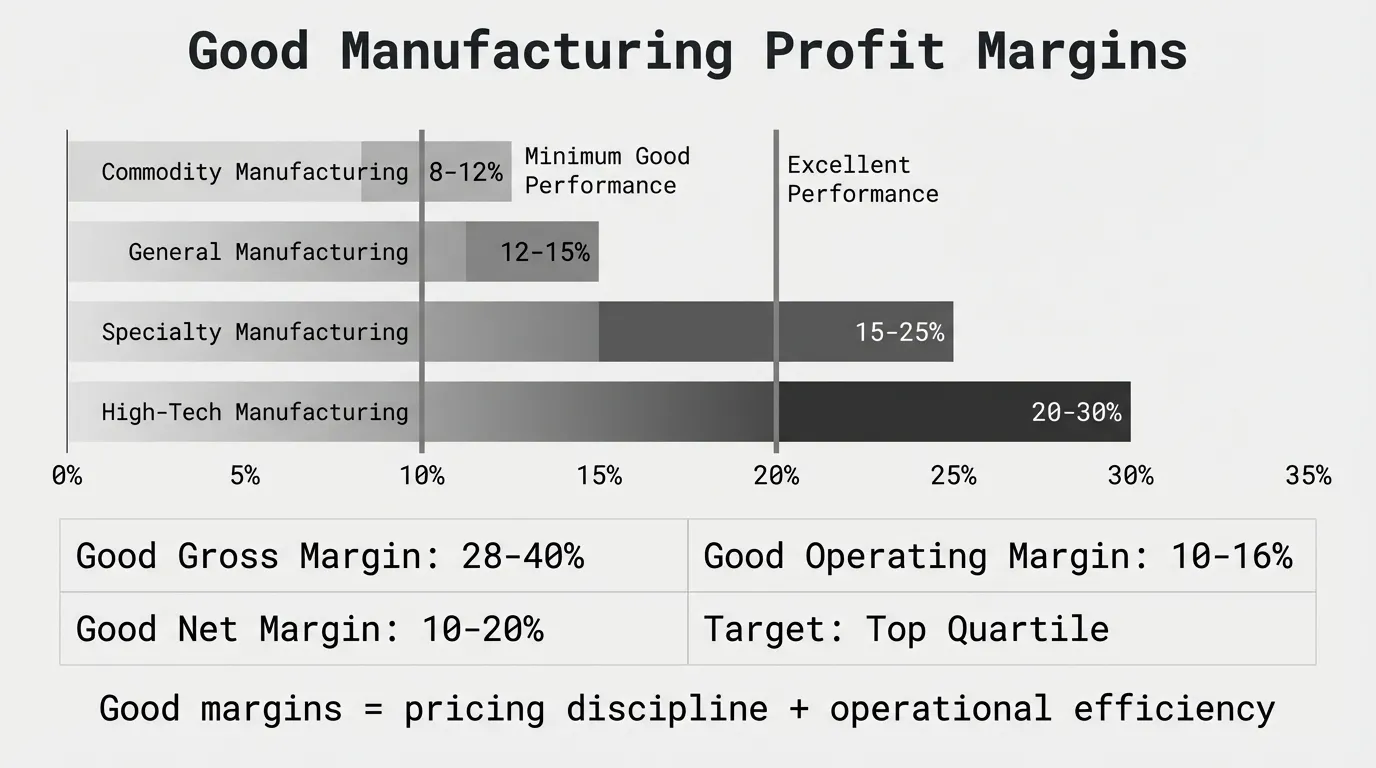
A good profit margin for manufacturing is 10-20% for net profit margin and 28-40% for gross margin. But "good" depends on what you manufacture and how you compete. A 12% net margin is excellent for an auto parts manufacturer but mediocre for a specialty chemicals company.
Commodity manufacturers competing on price should target 8-12% net margin. General manufacturers with moderate differentiation should aim for 12-15%. Specialty manufacturers with proprietary products or technical barriers should achieve 15-25%.
What Is Considered a Good Profit Margin in Manufacturing?
According to Vena Solutions' industry benchmarking data, manufacturers aim for 25-35% gross margins and 5-10% net margins on average. But average isn't the same as good. Top-performing manufacturers operate above these averages.
A good profit margin represents top-quartile performance. It shows a manufacturer has pricing power, operational efficiency, or both. It's a margin sustainable over time that allows reinvestment, debt service, and owner returns.
Target margins by margin type:
| Margin Type | Average Manufacturing | Good Performance | Excellent Performance |
|---|---|---|---|
| Gross Margin | 25-35% | 28-40% | 40-50%+ |
| Operating Margin | 7-12% | 10-16% | 16-22%+ |
| Net Profit Margin | 7-12% | 10-20% | 20-30%+ |
These targets apply to established manufacturers at steady-state operations. High-growth manufacturers often run lower margins temporarily while scaling. Manufacturers in turnaround mode may show poor margins until improvements take effect.
Good Profit Margin for Manufacturing by Sector
Manufacturing isn't one industry. A semiconductor fab has nothing in common with a food processor. Good margins vary dramatically by what you make and how you compete.
| Manufacturing Sector | Good Net Margin | Good Gross Margin | What Drives Success |
|---|---|---|---|
| Auto Parts | 8-12% | 18-25% | Volume, efficiency, cost control |
| Chemicals (Basic) | 9-12% | 28-35% | Scale, cost position, vertical integration |
| Chemicals (Specialty) | 15-22% | 42-55% | Technical expertise, customer intimacy, IP |
| Electrical Equipment | 12-16% | 32-40% | Product quality, brand, distribution |
| Food Processing | 8-12% | 20-28% | Scale, waste control, customer relationships |
| Industrial Machinery | 12-18% | 32-42% | Engineering capability, service, aftermarket |
| Metal Fabrication | 10-15% | 28-35% | Precision, quality, delivery reliability |
| Pharmaceuticals | 25-35% | 70-80% | IP, regulatory barriers, R&D efficiency |
| Plastics & Rubber | 10-14% | 28-36% | Material sourcing, process efficiency, scale |
| Semiconductors | 20-30% | 50-60% | Technology leadership, scale, yields |
Data compiled from NYU Stern's margin database (January 2026), industry surveys, and top-quartile company performance.
The pattern is clear: sectors producing differentiated, high-value products achieve higher good margins. Sectors producing commodity products set lower targets but still have meaningful performance gaps between average and good.
Good Margins for Commodity vs. Specialty Manufacturing
The biggest margin difference in manufacturing isn't sector-specific. It's business model. Commodity manufacturers and specialty manufacturers operate in fundamentally different competitive environments with different margin targets.
Commodity Manufacturing
What qualifies as commodity:
- Standardized products with multiple suppliers
- Customer switching costs are low
- Competition based primarily on price and delivery
- Examples: Standard fasteners, basic chemicals, commodity metal parts, basic food processing
Good margin targets:
- Gross margin: 20-28%
- Operating margin: 8-12%
- Net margin: 8-12%
What drives good performance:
- Being the low-cost producer through scale and efficiency
- Superior capacity utilization (85%+ consistently)
- Material cost advantages through sourcing or vertical integration
- Process efficiency (low scrap, high yields)
- Logistics and working capital optimization
A $40M fastener manufacturer producing standard bolts targets 24% gross margin and 10% net margin. Achieving this requires relentless focus on cost position, as customers view products as interchangeable. A manufacturer hitting these targets consistently demonstrates operational excellence.
Specialty Manufacturing
What qualifies as specialty:
- Differentiated products with technical barriers or IP
- Customer switching costs are high (qualification, integration, risk)
- Competition based on value, quality, and capability
- Examples: Medical devices, aerospace components, specialty chemicals, precision instruments
Good margin targets:
- Gross margin: 38-50%
- Operating margin: 16-24%
- Net margin: 15-25%
What drives good performance:
- Strong technical capabilities and application expertise
- Customer relationships that justify value-based pricing
- Intellectual property or process know-how
- Quality systems and certifications creating barriers
- Mix management favoring high-margin applications
A $30M precision machining company serving aerospace and medical devices targets 45% gross margin and 18% net margin. These margins reflect pricing power from regulatory barriers, tight tolerances, and customer qualification requirements. Hitting these targets shows the manufacturer captures appropriate value for differentiation.
What Is a Good Gross Profit Margin for Manufacturing?
Gross profit margin measures product profitability before operating expenses. It shows how much you keep from each revenue dollar after paying for materials, direct labor, and manufacturing overhead.
Gross Margin = (Revenue - COGS) / Revenue × 100Good gross margin targets:
| Manufacturer Type | Good Gross Margin | What It Means |
|---|---|---|
| Commodity | 20-28% | Efficient operations, competitive cost position |
| General Manufacturing | 28-35% | Solid product margins, operational control |
| Differentiated Products | 35-42% | Pricing power from quality or capability |
| Specialty/High-Tech | 42-55% | Strong differentiation, technical barriers |
A $15M metal fabrication company running 32% gross margin demonstrates good performance. This margin provides enough buffer to cover operating expenses (typically 18-22% of revenue) and still generate 10-14% net margin.
A $25M chemical manufacturer running 22% gross margin on commodity products shows good cost discipline. With tight operating expense control (8-10% of revenue), this delivers 9-12% net margin—solid for commodity chemicals.
What separates good gross margin from average:
-
Material cost management. Manufacturers achieving good gross margins actively manage input costs through supplier negotiations, alternative sourcing, volume consolidation, and forward contracts. They pass through cost increases to customers within 60-90 days, not 6-12 months.
-
Production efficiency. Good gross margins come from high yields, low scrap rates, optimized labor productivity, and capacity utilization above 80%. Average manufacturers tolerate inefficiency that erodes 3-5 points of margin.
-
Pricing discipline. Manufacturers with good gross margins enforce minimum margin thresholds by product category, require approval for exceptions, and actively manage product mix toward higher-margin items. Average manufacturers accept whatever margin each deal brings.
What Is a Good Net Profit Margin for Manufacturing?
Net profit margin is what remains after all costs—COGS, operating expenses, interest, and taxes. It represents true profitability and the return available to owners or for reinvestment.
Net Profit Margin = Net Profit / Revenue × 100According to FullRatio's industry profitability data, manufacturing typically achieves 7-12% net margins, with significant variation by sector. Good performance means consistently operating in the 10-20% range.
Good net margin benchmarks:
| Company Profile | Good Net Margin | Minimum Acceptable | Excellent |
|---|---|---|---|
| Commodity manufacturer (under $50M) | 8-12% | 5% | 12%+ |
| General manufacturer (under $50M) | 10-15% | 7% | 15%+ |
| Specialty manufacturer (under $50M) | 15-20% | 12% | 20%+ |
| Mid-size manufacturer ($50M-$200M) | 12-18% | 8% | 18%+ |
| Large manufacturer ($200M+) | 12-20% | 10% | 20%+ |
Why good net margins matter more than gross margins:
Gross margin tells you whether your products are profitable. Net margin tells you whether your business is profitable. A manufacturer can have strong 35% gross margin but poor 6% net margin if operating expenses are bloated, overhead is excessive, or the business carries too much debt.
A $50M machinery manufacturer running 34% gross margin and 8% operating expenses achieves 14% net margin after interest and taxes. This demonstrates good overall performance—not just product profitability but efficient business operations.
A $30M food processor running 20% gross margin and 12% operating expenses delivers 5% net margin. This manufacturer needs to either improve gross margin (pricing, material costs, efficiency) or reduce operating expenses to reach good performance.
Good Operating Profit Margin for Manufacturing
Operating profit margin measures profitability from core business operations before interest and taxes. It shows how efficiently a manufacturer converts revenue to profit through production and business operations.
Operating Margin = (Revenue - COGS - Operating Expenses) / Revenue × 100Good operating margin targets:
| Manufacturer Type | Good Operating Margin | Target Range |
|---|---|---|
| Commodity | 8-12% | 8-14% |
| General Manufacturing | 10-16% | 10-18% |
| Specialty | 16-24% | 16-28% |
Operating margin is often the clearest indicator of business quality. It strips out financing decisions (interest expense) and tax impacts, showing pure operational performance.
A manufacturer running 14% operating margin but only 9% net margin due to high interest expense has a good business carrying too much debt. The path to improvement is clear: pay down debt to convert operating profit to net profit.
A manufacturer running 8% operating margin and 6% net margin has an operational performance problem. Debt restructuring won't fix this. The manufacturer needs to improve gross margin, reduce operating expenses, or both.
How Company Size Affects Good Margin Targets
Larger manufacturers typically achieve better margins through economies of scale. But scale also brings complexity and overhead. Good margins vary by size.
Small Manufacturers (Under $20M Revenue)
Good margin targets:
- Gross margin: 28-40%
- Net margin: 10-15%
Small manufacturers can't compete on scale. Good performance comes from specialization, customer intimacy, or operational agility. A $12M precision parts manufacturer serving niche aerospace applications runs 42% gross margin and 16% net margin by focusing on a narrow technical domain where they have expertise.
Small manufacturers accepting commodity margins (below 10% net) rarely grow beyond $20M. The margin doesn't support the infrastructure, talent, and capital investment needed to scale.
Mid-Size Manufacturers ($20M-$100M Revenue)
Good margin targets:
- Gross margin: 28-38%
- Net margin: 12-16%
Mid-size manufacturers gain some scale benefits but haven't reached full efficiency. Good performance balances growth investment with profitability. A $65M industrial equipment manufacturer running 33% gross margin and 14% net margin demonstrates solid performance—enough margin to fund growth while generating owner returns.
Mid-size manufacturers running below 10% net margin struggle to invest in people, systems, and capacity needed to reach the next scale tier. Those running above 16% net margin either have strong differentiation or are under-investing in growth.
Large Manufacturers ($100M-$500M Revenue)
Good margin targets:
- Gross margin: 28-38%
- Net margin: 12-18%
Large manufacturers benefit from scale but face margin pressure from sophisticated customers and competitive intensity. Good performance means maintaining margin discipline as volume grows. A $280M manufacturer running 32% gross margin and 15% net margin shows they've captured scale benefits without sacrificing pricing discipline.
Large manufacturers running below 10% net margin either operate in commodity sectors (acceptable) or have allowed operational complexity to erode margins (problematic). Those running above 18% net margin have either achieved true differentiation or operate in favorable niches.
What Drives Good Manufacturing Profit Margins
Five factors separate manufacturers with good margins from those with average or poor margins:
1. Pricing Discipline
According to McKinsey's 2003 study "The Power of Pricing" published in McKinsey Quarterly, a 1% price improvement drives an 8% increase in operating profit for B2B companies.
Manufacturers with good margins implement systematic pricing processes:
Pass-through mechanisms. Material cost increases trigger price reviews within 30 days and customer notifications within 60 days. Increases are implemented with data supporting the change.
Value-based pricing for differentiated products. Cost-plus pricing is used only for commodity items. Engineered solutions, custom work, and technical products are priced based on customer value delivered.
Minimum margin guardrails. Floor margins are defined by product category. Exceptions require VP approval and are tracked monthly. High exception rates trigger sales incentive and discount policy reviews.
Quote discipline. Win rates are tracked by discount level. Manufacturers often find minimal win rate improvement from deep discounting—they're giving away margin without winning more business.
A $28M metal fabricator analyzed 2,400 quotes. Win rate at full price: 31%. Win rate with 10%+ discount: 34%. They stopped discounting and recovered 4 points of margin.
2. Operational Efficiency
Manufacturers with good margins run efficient operations:
High capacity utilization. Target 85%+ utilization. Manufacturers running 60-70% utilization carry 2-4 points of excess fixed overhead in their cost structure.
Low scrap and rework. Best-in-class manufacturers run under 2% scrap. Average manufacturers tolerate 4-6%. Each point of scrap directly reduces margin.
Labor productivity. Output per direct labor hour improves 3-5% annually through methods optimization, tooling improvements, and training.
Supplier management. Strategic sourcing, volume consolidation, and competitive bidding reduce material costs 2-4% annually.
A $45M plastics manufacturer reduced scrap from 5.8% to 2.1% over 18 months by implementing statistical process control and fixing root causes. This improved gross margin by 3.7 points and net margin by 2.8 points.
3. Product Portfolio Management
Not all products generate the same margin. Manufacturers with good margins actively manage mix:
SKU rationalization. Analysis typically reveals 20-30% of SKUs generate minimal or negative contribution margin. Good performers discontinue or reprice these items.
Mix optimization. Sales incentives and quoting guidance steer volume toward higher-margin products. Product line reviews happen quarterly, not annually.
New product introduction discipline. New products launch only when target margins are achievable. Products that can't meet minimum margin thresholds don't go to market.
A $38M manufacturer found that 22% of their 2,800 SKUs produced negative contribution margin after accounting for cost-to-serve. They discontinued 580 SKUs over 12 months and shifted that capacity to profitable products, improving net margin from 9% to 13%.
4. Cost Structure Discipline
Manufacturers with good margins control costs without sacrificing capability:
Operating expense targets. SG&A is benchmarked as a percentage of revenue by function (sales, admin, facilities). Performance is tracked monthly. Expense growth is held below revenue growth.
Overhead allocation. Manufacturing overhead is allocated to products based on actual consumption (machine hours, setups, materials handling). This reveals true product profitability and prevents cross-subsidization.
Automation ROI discipline. Capital investments in automation require clear payback calculations using fully-loaded labor costs. Projects with less than 3-year payback are prioritized.
Working capital management. Inventory turns, DSO, and DPO are managed actively. Every point of improvement in cash conversion cycle funds growth without external capital.
5. Customer Profitability Management
Good margins come from serving the right customers at the right price. Manufacturers with good margins analyze profitability at the customer level:
Customer margin analysis. Revenue, COGS, and cost-to-serve are calculated by customer. This reveals which relationships are truly profitable after accounting for all costs.
Service-level pricing. Customers requiring expedited delivery, custom packaging, engineering support, or consignment inventory pay separately for these services. Bundled pricing gives away margin.
Unprofitable customer remediation. Customers below minimum margin thresholds are repriced, renegotiated, or exited. A manufacturer shouldn't lose money serving any customer at steady-state.
A $52M distribution-focused manufacturer analyzed 340 customers. They found 65 customers (19% of count, 12% of revenue) produced negative pocket margin after freight, rebates, and service costs. They repriced these accounts and recovered 2.1 points of net margin.
How to Determine If Your Margin Is Good
A single margin number doesn't tell you if performance is good. Here's how to make the comparison meaningful:
1. Benchmark Against the Right Peers
Don't compare a food processor to a pharmaceutical company. Compare to:
- Direct competitors in your specific sub-sector
- Similar scale ($30M manufacturer vs. $300M)
- Similar business model (job shop vs. production runs)
- Similar complexity (commodity vs. specialty)
2. Analyze Trend, Not Just Level
A 9% net margin that's been stable for five years may be acceptable. A margin that declined from 15% to 9% over three years indicates a problem even though 9% seems reasonable.
Track margin trends by:
- Quarter over quarter (seasonal adjustments applied)
- Year over year (removes seasonality)
- Three-year rolling average (shows underlying direction)
3. Segment Your Margin Analysis
Company-wide margin hides what's happening underneath. Calculate margin by:
- Product category (which categories perform well?)
- Customer segment (are large customers more or less profitable?)
- Geography or facility (do different plants perform differently?)
- Order type (production vs. custom vs. rush)
A 12% overall net margin might hide 18% on specialty products and 6% on commodity items. The segmentation reveals where to focus improvement.
4. Compare Gross and Net Margins
The relationship between gross margin and net margin reveals business quality:
Strong gross, strong net: Good product margins and efficient operations. This is top-quartile performance.
Strong gross, weak net: Product margins are good but operating expenses or debt service consume the profit. The business has potential but operational issues.
Weak gross, strong net: Product margins are thin but operations are extremely efficient. This works for commodity manufacturers but isn't sustainable for others.
Weak gross, weak net: Both product profitability and operational efficiency are poor. This requires immediate action.
5. Calculate Your Margin Gaps
If your margin is below target, quantify the gaps:
Your company:
- Gross margin: 26%
- Operating margin: 9%
- Net margin: 6%
Good performance targets:
- Gross margin: 32%
- Operating margin: 14%
- Net margin: 11%
Gaps to close:
- Gross margin: 6 points
- Operating to net: 3 points (suggests high interest expense)
- Total net margin: 5 points
Breaking down the gaps shows where to focus improvement efforts.
How Manufacturers Achieve Good Profit Margins
Moving from average to good margins requires systematic improvement in pricing and operations:
Pricing Improvements
Implement value-based pricing for differentiated products. A precision manufacturer saving customers $150K annually in quality costs and downtime priced on value, not cost-plus. Margin improved from 28% gross to 38% gross on those applications.
Create systematic cost pass-through processes. Monthly material cost tracking with 5% change triggers for price reviews. Customer increases communicated with data. Pass-through lag reduced from 5 months to 2 months, recovering 2 points of margin.
Enforce minimum margin thresholds. Define floor margins by product category (commodity 18%, standard 25%, custom 35%). Require VP approval for exceptions. Track and review exceptions quarterly. Exception rates dropped from 38% of orders to 12%, improving blended margin.
Price services separately. Engineering support ($150/hr), rush orders (+15%), custom packaging (cost + 20%), inventory management programs (0.8% of annual volume). Unbundling services recovered margin previously bundled into base price.
Operational Improvements
Optimize capacity utilization. Fill unused capacity with profitable volume through adjacent markets, contract manufacturing, or new applications. A machinery manufacturer running 68% utilization added contract machining work at 30% gross margin. This covered fixed overhead and improved overall margin from 29% to 33%.
Attack scrap and rework systematically. Track by type, source, and cost. Focus on vital few causes (80/20 rule). A plastics manufacturer reduced scrap from 6.1% to 2.3% through mold improvements and process controls, improving gross margin by 2.9 points.
Reduce material costs through sourcing. Supplier negotiations, volume consolidation, alternative materials, geographic sourcing. A $35M manufacturer reduced material costs 4.2% through competitive bidding and supplier consolidation, improving net margin by 1.8 points.
Rationalize unprofitable SKUs. Identify products below minimum margin thresholds. Discontinue, reprice, or redesign. Free up capacity for profitable items. A $42M manufacturer cut 640 SKUs (28% of catalog) generating 4% of revenue and negative contribution. Overall margin improved by 3.1 points.
Control operating expense growth. Set SG&A targets as percentage of revenue by function. Hold expense growth below revenue growth. A manufacturer implemented zero-based budgeting for indirect spend and reduced SG&A from 19% to 16% of revenue over two years.
See our complete guide to improving profit margins for detailed strategies and our margin analysis guide for methods to identify improvement opportunities.
Is Your Manufacturing Margin Good Enough?
Knowing whether your profit margin is "good" compared to industry targets is useful context. The more actionable question is: what's preventing you from achieving good margins?
Most manufacturers have margin improvement opportunities hiding in transaction data:
- Pricing below minimum thresholds on specific products or customers
- Cost increases not fully passed through to customers
- Product mix drift toward lower-margin items
- Customers receiving high-touch service at low prices
- SKUs consuming capacity while generating minimal or negative margin
- Discounts that were supposed to be temporary but became permanent
Finding these opportunities requires analyzing transactions at the product, customer, and time-period level. For manufacturers with thousands of SKUs and hundreds of customers, Excel becomes unwieldy.
That's what Pryse is built for. Upload your transaction data and see exactly where your margin is going—and where it could be better—in 24 hours, not 6 months.
For more on manufacturing profitability, see our guides on average manufacturing profit margins, average manufacturing gross margins, and complete profit margin benchmarks by industry.
Sources:
Last updated: February 24, 2026
Frequently Asked Questions

Want to analyze your entire product catalog?
Pryse automatically identifies margin leakage across thousands of SKUs. Upload your data and find hidden profit in 24 hours.
One-time $1,499 diagnostic. No subscription required.