Retail Margins by Industry: Profit Benchmarks for Grocery, Apparel, and Electronics
Average retail margins range from 1-3% net margin for grocery to 4-13% for apparel. See detailed profit benchmarks for all major retail categories.
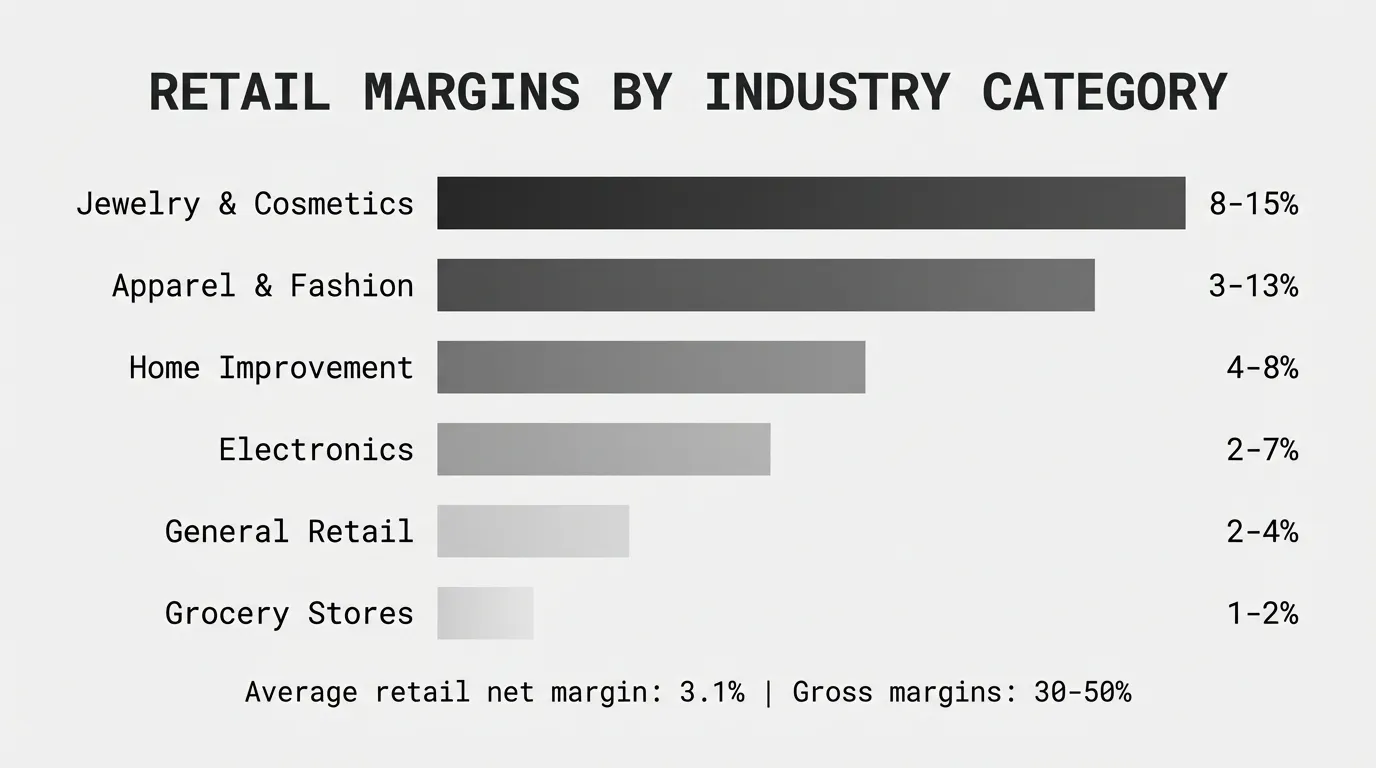
Retail margins vary dramatically by industry. Grocery stores run 1-2% net profit margin. Apparel retailers average 3-13%. Electronics stores operate at 2-7%. Jewelry and cosmetics reach 8-15%. The category determines the margin more than the retailer's skill.
According to NYU Stern's margin database updated January 2026, the average retail net profit margin across all categories is 3.1%, with gross margins averaging 30.9%.
Average Retail Margins Across All Categories
Before breaking down by industry, here's the baseline. Vena Solutions' industry benchmarking data and NYU Stern's retail sector analysis show consistent patterns across thousands of retailers:
| Margin Type | Retail Average | Range |
|---|---|---|
| Gross Margin | 30-50% | 15-70% |
| Operating Margin | 3-6% | 1-15% |
| Net Profit Margin | 2-10% | 1-20% |
These averages mask enormous variation. A grocery store at 25% gross margin and 1.2% net margin is normal. A cosmetics retailer at 65% gross margin and 12% net margin is also normal. The category matters more than the average.
Why Retail Margins Are Lower Than Other Industries
Retailers buy products and resell them without significant transformation. Your margin comes from buying well, minimizing costs, and charging what the market will bear. Unlike manufacturing or software, you don't create proprietary products with pricing power.
Three structural constraints keep retail margins tight:
1. Price transparency eliminates margin cushion. Customers compare prices instantly online. A retailer charging 15% above competitors loses sales unless they offer something beyond price. Price transparency compresses margins toward commodity levels.
2. High fixed costs consume gross margin. Rent, labor, utilities, and inventory carrying costs eat margin before reaching net profit. A retailer with 40% gross margin might spend 35% on operating expenses, leaving 5% net margin.
3. Low switching costs intensify competition. Customers can buy from any retailer. No switching costs mean constant pressure to match or undercut competitor pricing.
According to CSI Market's retail sector profitability data, the retail sector shows average gross margins of 30-35%, operating margins of 4-6%, and net margins of 2-4%—consistently below manufacturing, distribution, and service industries.
Retail Margins by Industry Category
The retail category determines margin structure. Here are benchmarks for major retail sectors:
| Retail Category | Gross Margin | Operating Margin | Net Margin | Source |
|---|---|---|---|---|
| Grocery Stores | 20-30% | 1.5-3% | 1-2% | NYU Stern, Vena Solutions |
| Apparel/Clothing | 40-55% | 5-10% | 3-13% | Industry data, NetSuite |
| Electronics | 15-30% | 2-5% | 2-7% | Industry average |
| Jewelry & Accessories | 40-65% | 8-15% | 8-15% | Industry data |
| Cosmetics & Beauty | 50-70% | 10-18% | 8-15% | Industry data |
| Home Improvement | 30-40% | 6-10% | 4-8% | Industry average |
| Sporting Goods | 30-40% | 4-8% | 3-7% | NYU Stern |
| Furniture/Home Decor | 35-45% | 5-9% | 4-12% | NetSuite |
| Beverage Retail | 60-70% | 6-12% | 4-8% | Statista 2018 |
| Alcoholic Beverages | 35-40% | 4-8% | 3-6% | Statista 2018 |
| Online/E-commerce | 60-70% | 5-12% | 3-10% | TrueProfit 2026 |
Data compiled from NYU Stern margin database, Vena Solutions benchmarking, NetSuite retail margin analysis, and TrueProfit 2026 retail data.
Grocery Store Margins
Grocery stores operate on the thinnest margins in retail. According to DataWiz's retail margin research, grocery retail posts an average gross margin of 25.5%, operating margin of 2.4%, and net margin of 1.2%.
Multiple industry sources confirm that grocery stores run 1-3% net profit margin, with most at the lower end of that range.
Why grocery margins are so low:
- Intense price competition. Customers know grocery prices and comparison shop actively. A 5% price difference on milk or eggs sends customers elsewhere.
- High perishable waste. Fresh produce, dairy, and meat spoil before selling. Shrinkage averages 2-3% of sales at grocery stores.
- Volume-based model. Grocery stores make money through turnover, not margin. Moving 50,000 items per week at 1.5% margin generates more profit than 10,000 items at 5% margin.
- Private label pressure. Store brands cannibalize higher-margin national brands while running lower margins themselves.
- Customer price sensitivity. Grocery is a frequent purchase. Customers notice and react to price increases immediately.
A regional grocery chain with $120M annual revenue running 26% gross margin and 1.8% net margin is performing well. The key metric is inventory turns per year (12-20x for grocery versus 4-8x for other retail).
Apparel and Clothing Retail Margins
Apparel shows the widest margin range in retail. According to industry benchmarking data, apparel and clothing retailers average 3.15% net margin, but this combines discount retailers at 2-4% with specialty and luxury retailers at 10-15%.
NetSuite's retail profitability analysis shows fashion and apparel net margins of 4-13%, with gross margins of 40-55%.
Margin drivers in apparel:
Brand positioning determines ceiling. A discount apparel retailer competes on price and runs 40% gross margin. A luxury brand retailer commands 60%+ gross margin through brand value, exclusivity, and customer willingness to pay.
Seasonal clearance erodes margin. Apparel is seasonal. Items that don't sell at full price get marked down 30-70%. The retailer's gross margin reflects the mix of full-price versus clearance sales.
Fast fashion versus specialty. Fast fashion retailers (Zara, H&M model) run 8-12% net margin through volume and rapid turnover. Specialty retailers run 10-15% net margin through differentiation and brand loyalty.
E-commerce versus brick-and-mortar. Online apparel retailers save rent but pay for fulfillment, returns, and customer acquisition. Net margins are similar (5-10%) despite different cost structures.
A $40M apparel retailer with 48% gross margin, 8% operating margin, and 6% net margin is healthy for mid-market specialty retail. Discount apparel at those margins would be exceptional.
Electronics Retail Margins
Electronics retail operates on slim margins due to price transparency and commoditization. According to retail margin research, electronics typically operate at 2-7% net margin.
More specifically, industry data shows consumer electronics gross profit margins average 29.1%, while computer retailers average 17.47%.
Why electronics margins are compressed:
Instant price comparison. Customers check prices on smartphones while in-store. A retailer charging $50 more for a TV than Amazon loses the sale.
Rapid product obsolescence. Electronics depreciate quickly. A laptop model released six months ago sells at reduced margin to clear inventory before the next generation arrives.
Manufacturer pricing power. Apple, Samsung, Sony, and other brands control pricing and margins. Retailers have limited ability to mark up above MSRP.
Showrooming. Customers view products in physical stores then buy online from the lowest-price seller. This forces brick-and-mortar retailers to match online pricing while carrying higher costs.
Low differentiation. A 55" Samsung TV is identical whether purchased from Best Buy, Walmart, or Amazon. Pure commodity competition.
An electronics retailer with 25% gross margin and 4% net margin is performing solidly. Success comes from extended warranties, accessories, and services—not product margin.
Jewelry and Cosmetics Retail Margins
Jewelry and cosmetics represent the high end of retail margins. Industry data indicates these categories achieve gross margins as high as 60-65%.
According to Statista's retail margin data, jewelry stores and cosmetics retailers run among the highest margins in retail.
Why margins are high:
Low price transparency. Jewelry pricing is opaque. Customers can't easily compare diamond quality or gold purity across retailers. This opacity allows margin expansion.
Perceived value exceeds cost. A $200 cosmetics product may cost $30 to manufacture. Customers pay for brand, packaging, experience, and aspiration—not material cost.
Brand differentiation. Cosmetics and jewelry are heavily branded. A Chanel lipstick or Tiffany ring commands premium pricing that private label can't match.
Low commoditization. Unlike electronics or grocery, jewelry and cosmetics vary significantly by brand, style, and formulation. Customers don't see them as interchangeable.
Experiential retail. High-end jewelry and cosmetics retailers invest in experience—store design, personal service, packaging. This justifies premium pricing and protects margin.
A specialty cosmetics retailer with 65% gross margin and 12% net margin is normal. A jewelry store with 55% gross margin and 15% net margin is strong but not unusual.
Beverage Retail Margins
Beverage retail shows split performance. According to Statista's 2018 gross margin data, non-alcoholic beverage retailers achieved the highest gross profit margin in retail at 65.74%, while alcoholic beverage retailers ran 35.64%.
Non-alcoholic beverage margins (coffee, tea, smoothies):
High gross margins (60-70%) come from low input costs, high perceived value, and experiential retail. A $5 latte costs $0.60 in materials. Customers pay for convenience, atmosphere, and brand.
Operating margins compress to 6-12% due to labor costs, rent in high-traffic locations, and equipment. Net margins average 4-8%.
Alcoholic beverage retail margins:
Lower gross margins (35-40%) reflect pricing regulations, excise taxes, and competitive pressure. Beer, wine, and spirits are price-transparent commodities in most markets.
Net margins average 3-6%. Success comes from volume, selection, and convenience—not high per-unit margins.
Online Retail (E-commerce) Margins
E-commerce margins differ from brick-and-mortar in structure but not outcome. According to TrueProfit's 2026 e-commerce analysis, most e-commerce businesses sit around 60-65% gross margin, with successful stores targeting 60-70%.
NetSuite's retail margin data shows online retail net margins of 3-10%, similar to physical retail.
Why e-commerce gross margins are higher:
No wholesale markup. Direct-to-consumer brands avoid wholesale margins that retail stores require. A product with $20 COGS sells for $70 online versus $30 wholesale, then $70 retail.
Lower rent. E-commerce avoids expensive retail locations. A warehouse in a low-cost area replaces high-traffic storefronts.
But net margins converge:
Fulfillment costs. Picking, packing, and shipping individual orders costs $5-12 per order. This replaces retail labor but costs similarly.
Customer acquisition. Online retailers pay 15-30% of revenue on marketing to acquire and retain customers. Physical retail pays rent for foot traffic.
Returns. E-commerce return rates average 20-30% versus 5-10% for brick-and-mortar. Processing returns consumes margin.
Technology costs. Platform fees, payment processing, and tech infrastructure cost 5-8% of revenue.
An e-commerce retailer with 65% gross margin and 8% net margin performs similarly to a physical retailer with 40% gross margin and 6% net margin—different cost structure, similar profitability.
Factors That Determine Retail Margins
Six factors explain margin variation within retail categories:
1. Product Differentiation
Commoditized products (electronics, basic apparel, grocery staples) face margin pressure. Differentiated products (specialty items, branded goods, unique formulations) command premium margins.
A grocery store selling milk competes purely on price. The same store selling artisan cheese or imported specialty foods earns higher margins.
2. Brand Strength
Strong brands allow premium pricing. A luxury apparel brand charges 3x a no-name brand for similar quality because customers pay for the brand.
Private label retailers (Trader Joe's, Costco Kirkland) use brand strength to capture margin that national brands usually take.
3. Customer Price Sensitivity
Price-sensitive categories (grocery, basic apparel, consumer electronics) compress margins. Price-insensitive categories (luxury goods, specialty items, experiential retail) expand them.
4. Inventory Turnover
High-turnover retailers (grocery at 15x/year) make profit through volume at low margins. Low-turnover retailers (furniture at 3-4x/year) need higher margins to cover carrying costs.
Annual profit per square foot = (Margin × Price) × Inventory turns
Low margin × High turns = High margin × Low turns
A grocery store at 1.8% margin turning inventory 16x/year generates similar profit per square foot as a furniture store at 8% margin turning inventory 3.5x/year.
5. Operating Expense Structure
Labor-intensive retail (specialty stores with high service) needs higher gross margins to cover costs. Low-touch retail (warehouse clubs, discount stores) operates profitably at lower gross margins.
A specialty cosmetics boutique with 65% gross margin spends 50% of revenue on labor, rent, and service. Net margin is 8%. A warehouse club with 12% gross margin spends 9% on operations. Net margin is also 8%.
6. Geographic Location
Retailers in high-cost markets (Manhattan, San Francisco) need higher gross margins to offset rent and labor costs. Retailers in low-cost markets operate profitably at lower gross margins.
A coffee shop in Manhattan running 68% gross margin and 6% net margin competes with a suburban coffee shop at 62% gross margin and 7% net margin.
Warning Signs of Margin Problems in Retail
Declining gross margin while costs are stable. This signals pricing pressure, increased discounting, or unfavorable product mix shifts. A retailer whose gross margin dropped from 42% to 37% over two years has a pricing or assortment problem.
Gross margin stable but net margin declining. Operating expenses are growing faster than sales. This points to labor inefficiency, rent increases, or overhead bloat. A retailer at 48% gross margin seeing net margin drop from 8% to 4% needs to address costs.
High shrinkage eating margin. Retail shrinkage (theft, damage, administrative errors) averages 1.4% of sales according to National Retail Federation data, but poorly-controlled stores hit 3-5%. That shrinkage comes directly out of margin.
Excessive markdowns. Retailers buying inventory that doesn't sell at full price mark it down 40-70%. Markdown rates above 15-20% of sales indicate buying problems, not just seasonal clearance.
Inventory aging. Old inventory consumes cash and warehouse space while depreciating in value. Electronics and apparel lose value quickly. Retailers with significant aged inventory face margin erosion when they finally clear it.
Margin variation by location. A retailer with five stores averaging 6% net margin but one store at -2% margin has a location, management, or shrinkage problem. Aggregate margin hides underperforming stores.
How to Improve Retail Profit Margins
Margin improvement comes from pricing discipline, cost control, and mix management.
Pricing Strategies
Implement dynamic pricing for non-commodity items. Adjust prices based on demand, seasonality, and competitive position. Items with low price sensitivity can bear 5-15% increases without volume loss.
Reduce excessive discounting. Track promotion effectiveness by measuring incremental volume versus margin loss. Many retailers discover that 20% off sales generate minimal volume lift while destroying margin.
Optimize promotional timing. Markdowns should clear slow inventory, not discount fast-moving items. A retailer discounting best-sellers during peak season leaves profit on the table.
Establish minimum advertised pricing. For products where the retailer has control, set floor pricing that protects margin even during promotions.
Cost Control Strategies
Negotiate supplier terms. Retailers with scale should extract better cost-of-goods through volume commitments, payment terms (2/10 net 60), and return privileges.
Reduce shrinkage. Improved inventory controls, better staff training, and loss prevention reduce shrinkage from 3% to 1.5%, recovering 1.5 points of margin.
Optimize labor scheduling. Match staffing to traffic patterns. Overstaffing during slow periods wastes 5-10% of labor budget. Schedule to demand, not tradition.
Renegotiate rent. In soft commercial real estate markets, retailers with leverage can reduce rent 10-20% through lease renegotiation or relocation.
Mix Management Strategies
SKU rationalization. Eliminate low-margin, slow-moving products that consume shelf space and capital. A typical analysis reveals 20-30% of SKUs generating minimal or negative contribution.
Shift mix toward higher-margin categories. A grocery store expanding prepared foods (40% margin) relative to packaged goods (22% margin) improves overall margin through mix.
Introduce private label. Store brands capture the retail margin and wholesale margin. A private label product with 45% margin replaces a national brand with 30% margin.
Expand services and add-ons. Extended warranties, installation, customization, and services carry higher margins than physical products. An electronics retailer makes more profit on a $150 warranty than a $500 TV.
For detailed methods on analyzing margins by product and customer segment, see our complete guide to margin analysis.
Comparing Your Retail Margin to Benchmarks
A single profit margin number doesn't tell you much. Here's how to make the comparison meaningful:
1. Use the Right Category Benchmark
Don't compare a grocery store to a cosmetics retailer. Both are "retail" but operate in completely different margin environments. Compare to direct competitors in your category at similar scale.
2. Calculate Margins Consistently
Make sure you're calculating margins the same way benchmarks do:
- Gross margin: Include product cost and inbound freight in COGS. Don't include store labor, rent, or marketing.
- Operating margin: Include all operating expenses (labor, rent, marketing) but exclude interest and taxes.
- Net margin: Use net income after all expenses, interest, and taxes.
3. Segment Your Analysis
Company-wide margin hides what's happening underneath. Calculate margin by:
- Product category: Which categories drive profit versus dragging down the average?
- Store location: Do different stores perform differently?
- Sales channel: In-store versus online versus wholesale
- Customer segment: Retail versus business customers
- Time period: Is margin trending up, down, or flat?
A 5% overall net margin might mask 10% margin on specialty items and 1% margin on promotional items. The insight is in the segmentation.
4. Track Trend, Not Just Level
A net profit margin that declined from 7% to 3% over two years is more concerning than a stable 2%. Trend direction matters as much as absolute level.
If margin is declining, identify why before benchmarking. Common causes:
- Competitive pressure forcing price reductions
- Unfavorable product mix shifts
- Operating expense growth outpacing sales
- Increased markdowns and promotions
- Shrinkage or waste increasing
The Relationship Between Gross Margin and Net Margin
Retail gross margin shows whether your product costs and pricing are healthy. Net margin shows whether your business model works.
A retailer with healthy gross margin (45%) but weak net margin (2%) has an operating expense problem. A retailer with weak gross margin (22%) and weak net margin (1%) has a pricing or COGS problem.
Example analysis for retailers:
| Scenario | Gross Margin | Operating Margin | Net Margin | Diagnosis |
|---|---|---|---|---|
| Retailer A | 48% | 8% | 6% | Healthy across all metrics |
| Retailer B | 48% | 2% | 1% | Operating expense problem—gross margin is fine |
| Retailer C | 25% | 3% | 2% | Pricing/COGS problem—margins compressed from the start |
| Retailer D | 62% | 12% | 9% | Strong performance—above category average |
This diagnostic approach tells you where to focus. Retailer B shouldn't waste time on pricing analysis—they need to address operating expenses. Retailer C needs to fix pricing or reduce product costs.
Where Is Your Retail Margin Going?
Knowing whether your profit margin is "good" compared to category benchmarks is useful context. But the more actionable question is: where is margin leaking in your business?
Most retailers have 2-5 percentage points of recoverable margin hiding in operations:
- Excessive markdowns on items that should have sold at full price
- Shrinkage from theft, damage, or administrative errors
- Unfavorable product mix shifts toward low-margin items
- Operating expense creep (labor, rent, utilities) outpacing sales
- Pricing inconsistency across stores or channels
- Poor inventory management creating aged, marked-down stock
For retailers with hundreds of SKUs and multiple locations, finding these margin leaks requires transaction-level analysis. Excel becomes unwieldy at scale.
While Pryse is built for distribution and manufacturing companies, the margin analysis principles apply to retail. For more on profit benchmarking across industries, see our complete guide to profit margins by industry.
For retail-specific profitability, see what is a good profit margin for broader context across business types.
Last updated: February 24, 2026
Frequently Asked Questions

Want to analyze your entire product catalog?
Pryse automatically identifies margin leakage across thousands of SKUs. Upload your data and find hidden profit in 24 hours.
One-time $1,499 diagnostic. No subscription required.