What Is a Good Operating Profit Margin? Industry Benchmarks & Targets
A good operating margin is 10-15% for most businesses, but varies by industry. Software companies target 20%+, while distributors target 5-8%.
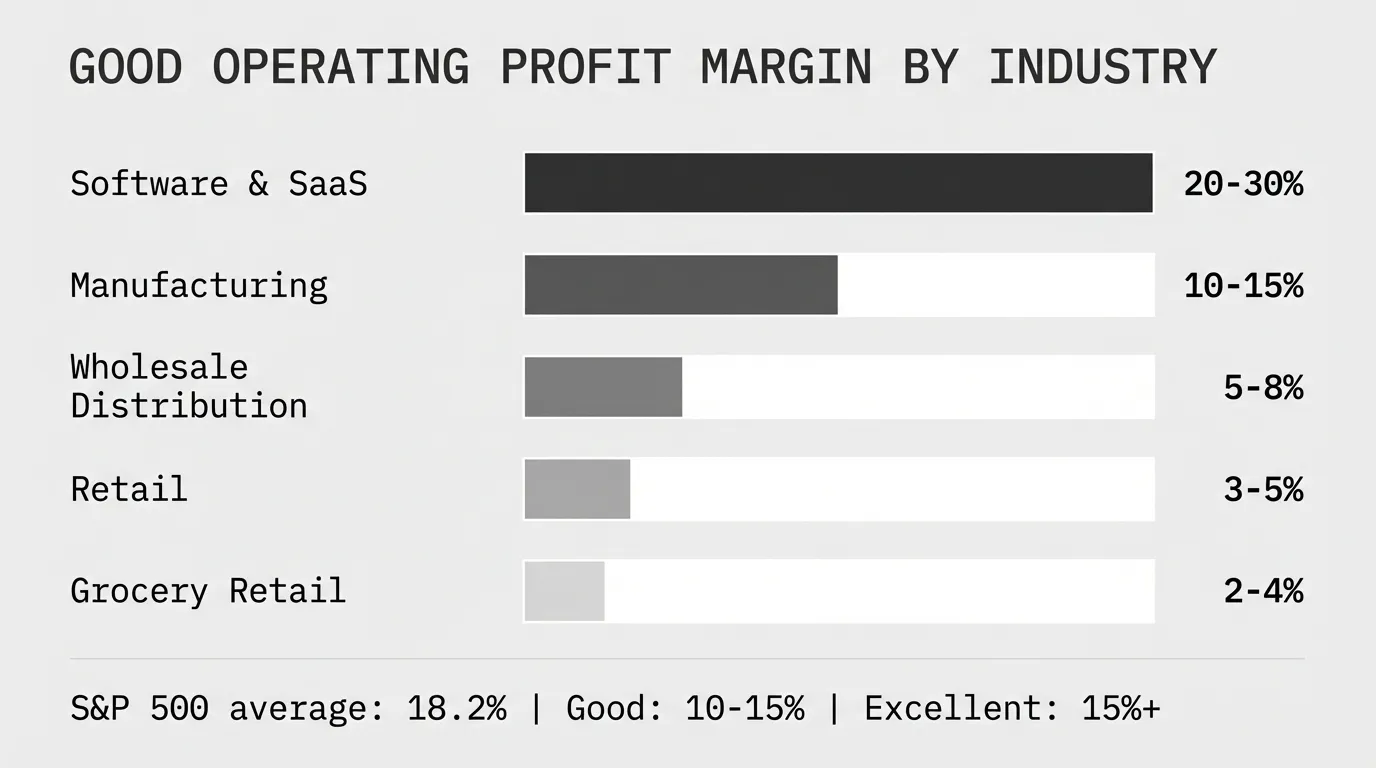
A good operating profit margin is 10-15% for most industries, but the target varies significantly by business model and sector. Software companies aim for 20-30% operating margins, while distributors consider 5-8% good performance.
The S&P 500 average operating margin is 18.2%, according to FullRatio's industry profitability data. But this number blends high-margin tech companies with low-margin retailers. Comparing your operating margin to a general average is meaningless.
What Is Operating Profit Margin?
Operating profit margin measures how much profit your business keeps from each revenue dollar after paying both production costs and operating expenses, but before interest and taxes.
Operating Margin = (Operating Income / Revenue) × 100Where:
Operating Income = Revenue - COGS - Operating ExpensesA 12% operating margin means you keep $0.12 from every $1.00 in sales after covering COGS (materials, direct labor, production overhead) and operating expenses (salaries, rent, marketing, utilities, depreciation).
Operating margin is also called EBIT margin (Earnings Before Interest and Taxes). It strips out financing decisions and tax rates to show pure operational performance.
For a detailed explanation of the calculation, see our operating margin formula guide.
Good Operating Margin Benchmarks by Industry
According to Vena Solutions' industry benchmarking analysis, operating margins vary from single digits in commodity businesses to 30%+ in asset-light service companies.
| Industry | Good Operating Margin | Average Operating Margin | What Drives Good Performance |
|---|---|---|---|
| Software & SaaS | 20-30% | 15-25% | Minimal COGS, scalability, recurring revenue |
| Pharmaceuticals | 18-25% | 12-18% | IP protection, regulatory barriers, pricing power |
| Financial Services | 15-25% | 10-20% | Specialized expertise, minimal material costs |
| Industrial Manufacturing | 10-15% | 7-12% | Operational efficiency, scale, product mix |
| Business Services | 10-18% | 8-15% | Labor productivity, pricing discipline |
| Wholesale Distribution | 5-8% | 3-6% | High volume efficiency, cost discipline |
| Auto Manufacturing | 5-10% | 3-7% | Scale advantages, supply chain optimization |
| Food Distribution | 3-5% | 2-4% | Ultra-thin margins, volume-driven |
| Retail (General) | 3-5% | 2-4% | Inventory management, operational efficiency |
| Grocery Retail | 2-4% | 1-3% | Volume, waste control, shrinkage management |
Data compiled from NYU Stern's margin database (January 2026), FullRatio industry benchmarks, and publicly-traded company financials.
What Is a Good Operating Margin for Manufacturing?
A good operating margin for manufacturing is 10-15%, with commodity manufacturers targeting 8-12% and specialty manufacturers targeting 15-20%.
NYU Stern's industry data shows manufacturing operating margins vary by sub-sector:
| Manufacturing Sector | Good Operating Margin | Average Operating Margin |
|---|---|---|
| Pharmaceuticals | 18-25% | 12-18% |
| Semiconductors | 18-25% | 12-20% |
| Industrial Machinery | 12-16% | 9-14% |
| Electrical Equipment | 10-14% | 8-12% |
| Chemicals (Specialty) | 12-18% | 9-15% |
| Chemicals (Basic) | 8-12% | 6-10% |
| Metal Fabrication | 8-12% | 6-10% |
| Auto Parts | 6-10% | 4-8% |
| Food Processing | 6-10% | 4-8% |
A $45M industrial machinery manufacturer running 13% operating margin demonstrates good performance—strong enough to reinvest in equipment, service debt, and provide owner returns.
A $60M metal fabricator running 7% operating margin sits below good performance. While not crisis territory, this margin provides limited cushion for economic downturns or competitive pressure.
What drives good manufacturing operating margins:
-
Pricing discipline. According to McKinsey's 2003 article "The Power of Pricing" published in McKinsey Quarterly, a 1% price improvement drives an 8% increase in operating profit. Manufacturers with good margins enforce minimum margin thresholds and systematically pass through cost increases.
-
Capacity utilization. Manufacturers running 85%+ utilization spread fixed overhead across more units, improving operating margin by 2-4 points compared to 65% utilization.
-
Operational efficiency. Top-quartile manufacturers run under 2% scrap rates, optimize direct labor productivity, and control overhead growth below revenue growth.
-
Product mix. Not all products contribute equally. Manufacturers achieving good operating margins actively manage mix toward higher-margin items and rationalize unprofitable SKUs.
See our guide on good profit margins for manufacturing for detailed benchmarks by sector.
What Is a Good Operating Margin for Distribution?
A good operating margin for distribution is 5-8%, with specialty distributors achieving 7-10% and commodity distributors targeting 4-6%.
Distribution operates on thin margins. According to Vena Solutions' benchmarking, wholesale distribution averages 3-6% operating margin. Top performers operate 2-3 points above this.
| Distribution Type | Good Operating Margin | Average Operating Margin |
|---|---|---|
| Specialty Distribution | 7-10% | 5-8% |
| Industrial/MRO Distribution | 6-8% | 4-6% |
| Building Materials | 5-7% | 3-5% |
| Electrical Distribution | 5-7% | 3-5% |
| HVAC Distribution | 5-7% | 3-5% |
| Food Distribution | 3-5% | 2-4% |
A $75M electrical distributor running 6.5% operating margin demonstrates good performance. This margin level shows disciplined pricing, efficient warehouse operations, and effective cost control.
A $40M building materials distributor running 3.8% operating margin sits below good performance. While the business may be profitable, there's minimal buffer for margin compression.
What separates good distributors from average:
-
Pricing consistency. Distributors with good operating margins track pocket price waterfall, identify margin leakage sources, and systematically address discounting patterns that erode profitability. See our price waterfall analysis guide.
-
Operational density. Higher sales per square foot, inventory turns above 6×, and optimized delivery routes reduce cost-to-serve.
-
Customer profitability management. Not all customers are profitable after accounting for freight, rebates, and service costs. Top performers analyze profitability by customer and reprice unprofitable relationships.
-
Supplier relationships. Negotiated volume rebates, early payment discounts, and marketing development funds add 1-2 points to operating margin when captured systematically.
What Is a Good Operating Margin for Small Businesses?
A good operating margin for small businesses is 8-15%, depending on industry and growth stage. Established small businesses should target industry benchmarks. High-growth businesses may temporarily run lower margins while scaling.
Small businesses under $20M revenue face different margin dynamics than large companies:
Advantages:
- Lower overhead complexity
- Faster decision-making
- Direct customer relationships
- Operational agility
Disadvantages:
- Limited scale economies
- Higher per-unit costs
- Less pricing power with suppliers
- Fixed costs spread across fewer sales
A $8M specialty manufacturer running 14% operating margin demonstrates good performance through focus and customer intimacy. This margin supports owner income, debt service, and growth investment.
A $12M distributor running 6% operating margin sits at average performance. The margin covers operations but provides limited reinvestment capacity.
Small business operating margin by industry:
| Industry | Good Operating Margin | Minimum Acceptable |
|---|---|---|
| Professional Services | 15-25% | 10% |
| Software/Tech | 15-25% | 10% |
| Specialty Manufacturing | 12-18% | 8% |
| General Manufacturing | 10-15% | 7% |
| Distribution | 6-10% | 4% |
| Retail | 5-8% | 3% |
Small businesses running below minimum acceptable margins struggle to invest in growth, weather downturns, or attract financing. Those running above good benchmarks either have strong differentiation or are under-investing in capabilities.
Operating Margin vs EBITDA Margin
Operating margin includes depreciation and amortization expenses. EBITDA margin excludes them. EBITDA margins are always higher than operating margins.
Operating Margin = (Revenue - COGS - OpEx) / RevenueEBITDA Margin = (Revenue - COGS - OpEx + D&A) / RevenueFor a $50M manufacturer with $7M in operating income and $2M in depreciation and amortization:
- Operating margin: ($7M / $50M) = 14%
- EBITDA margin: ($9M / $50M) = 18%
When to use each metric:
Operating margin better reflects true profitability for capital-intensive businesses. Depreciation represents real economic costs—equipment wears out and needs replacement.
EBITDA margin is useful for comparing companies with different capital structures or tax situations. Private equity often uses EBITDA multiples for valuation.
According to TrueProfit's operating margin analysis, companies emphasize EBITDA margins because they're almost always higher than operating margins, but EBITDA can hide serious problems.
A manufacturer with rising EBITDA margin but falling operating margin may be generating more revenue from aging equipment without reinvesting—a pattern that's not sustainable long-term.
For operational performance measurement, operating margin is the more honest metric.
Operating Margin vs Gross Margin vs Net Margin
These three margins measure profitability at different levels of the income statement:
| Margin Type | Formula | What It Measures |
|---|---|---|
| Gross Margin | (Revenue - COGS) / Revenue | Product profitability |
| Operating Margin | (Revenue - COGS - OpEx) / Revenue | Operational efficiency |
| Net Margin | Net Profit / Revenue | Total profitability |
Gross margin shows whether products are priced above direct costs. A distributor buying at $70 and selling at $100 has 30% gross margin.
Operating margin adds in overhead. That same distributor paying warehouse staff, rent, utilities, and sales salaries might see operating margin drop to 8%.
Net margin includes financing costs and taxes. After interest expense on inventory financing and corporate taxes, net margin might land at 5%.
Why all three matter:
A manufacturer with strong 38% gross margin but weak 6% operating margin has good product pricing but excessive overhead. The improvement path is clear: reduce operating expenses.
A distributor with weak 22% gross margin but decent 7% operating margin runs extremely efficient operations on thin product margins. Improving gross margin through pricing or mix would significantly boost profitability.
A company with strong 35% gross margin, strong 18% operating margin, but weak 8% net margin carries too much debt. The business is operationally sound but over-leveraged.
For complete margin analysis methodology, see our margin analysis guide.
Five Factors That Drive Good Operating Margins
1. Pricing Power
Your ability to raise prices without losing customers directly impacts operating margin. A 2% price increase on a business with 30% gross margin can add 2 full percentage points to operating margin.
Companies with good operating margins implement:
- Value-based pricing for differentiated products
- Systematic cost pass-through processes (monthly material cost tracking, 60-day price adjustments)
- Minimum margin thresholds by product category with exception tracking
- Separate pricing for services (engineering support, rush orders, custom packaging)
2. COGS Management
Material costs and direct labor represent the largest expense for manufacturers and distributors. Small improvements compound across thousands of transactions.
Top performers achieve good margins through:
- Strategic sourcing and supplier negotiations
- Volume consolidation for price leverage
- Alternative material sourcing and forward contracts
- Yield improvement and scrap reduction
- Supply chain optimization
3. Operating Expense Control
Operating expenses (salaries, rent, utilities, marketing, depreciation) typically run 15-25% of revenue. Companies with good operating margins set targets by function and track monthly.
Discipline areas:
- SG&A benchmarked as percentage of revenue
- Expense growth held below revenue growth
- Zero-based budgeting for indirect spend
- Automation ROI discipline (3-year payback minimum)
- Facility and logistics optimization
4. Labor Productivity
Labor represents the largest operating expense for most businesses. Revenue per employee serves as a proxy for productivity.
A $60M manufacturer with 150 employees generates $400K per head. Improving to $440K per employee through process optimization, automation, or better training directly boosts operating margin.
5. Product/Customer Mix
Not all revenue contributes equally to operating margin. Companies with good margins actively manage mix toward profitable products and customers.
Mix management tactics:
- SKU rationalization (discontinue or reprice unprofitable items)
- Customer profitability analysis (identify and address unprofitable relationships)
- Sales incentives aligned to margin, not just revenue
- Quote guidance steering toward higher-margin applications
How to Improve Operating Profit Margin
Moving from average to good operating margins requires systematic improvement across pricing and operations:
Pricing Improvements
Implement value-based pricing. A precision manufacturer saving customers $180K annually in quality costs priced on value, not cost-plus. Gross margin improved from 26% to 36%, flowing directly to operating margin.
Create cost pass-through processes. Monthly material cost tracking with 5%+ change triggers for price reviews. Pass-through lag reduced from 6 months to 2 months, recovering 1.5 points of operating margin.
Enforce minimum margins. Define floor margins by product category (commodity 15%, standard 22%, custom 32%). Require approval for exceptions. Track and review quarterly. Exception rates dropped from 42% of orders to 14%, improving blended margin.
Operational Improvements
Optimize capacity utilization. A machinery manufacturer running 67% utilization added contract work at 28% gross margin. This covered fixed overhead and improved overall operating margin from 8% to 11%.
Attack cost drivers systematically. A $38M distributor reduced freight costs from 4.2% to 3.1% of revenue through route optimization and carrier negotiations, improving operating margin by 1.1 points.
Rationalize unprofitable SKUs. A $48M manufacturer cut 740 SKUs (31% of catalog) generating 5% of revenue and negative contribution. Overall operating margin improved by 2.4 points.
Control overhead growth. Implement percentage-of-revenue targets by department. A manufacturer reduced SG&A from 18% to 15% of revenue over 18 months through zero-based budgeting.
See our complete guide to improving profit margins for detailed strategies.
What Is Considered a Healthy Operating Margin?
According to TrueProfit's 2026 benchmarking, a healthy operating margin exceeds your industry average and improves over time. A margin improving quarter over quarter is a stronger signal than one impressive spike.
General health indicators:
| Operating Margin | Assessment | What It Means |
|---|---|---|
| Below industry average | Poor | Pricing or cost structure problems |
| At industry average | Acceptable | Competitive but undifferentiated |
| 1-3 points above average | Good | Strong operational performance |
| 3-5 points above average | Excellent | Top-quartile efficiency or differentiation |
| 5+ points above average | Outstanding | Market leadership or niche dominance |
For mid-market distribution and manufacturing ($20M-$200M revenue):
- Below 5%: Problematic. Limited cushion for downturns, minimal reinvestment capacity
- 5-8%: Acceptable for commodity businesses, below target for differentiated companies
- 8-12%: Good performance for most sectors
- 12-15%: Excellent performance, top-quartile
- 15%+: Outstanding, indicates strong differentiation or operational excellence
Trend matters more than level. A 7% operating margin that's been stable for three years may be acceptable. A margin that declined from 14% to 7% over two years signals serious problems.
Track your operating margin:
- Monthly (understand variability and seasonality)
- Quarterly (assess trends)
- Rolling 12-month (remove seasonality, show direction)
How to Know If Your Operating Margin Is Good
Comparing to general benchmarks is a starting point. Making the assessment meaningful requires context:
1. Compare to Direct Competitors
Don't compare a food processor to a pharmaceutical company. Benchmark against:
- Direct competitors in your sub-sector
- Similar scale ($40M vs. $300M)
- Similar business model (make-to-stock vs. custom)
- Similar market position (commodity vs. specialty)
2. Analyze the Trend
A declining operating margin indicates problems even if the absolute level seems reasonable:
- Improving margin: Good—shows operational leverage, pricing discipline, or both
- Stable margin: Acceptable—consistent performance
- Declining margin: Problematic—cost structure deteriorating faster than revenue growth, pricing pressure, or margin leakage
3. Segment Your Analysis
Company-wide operating margin hides what's happening underneath. Calculate operating margin by:
- Product category (which categories perform well?)
- Customer segment (are large customers more or less profitable?)
- Geography or facility (do different locations perform differently?)
- Channel (direct vs. distribution vs. online)
A 9% overall operating margin might hide 15% on specialty products and 4% on commodity items. The segmentation reveals where to focus.
4. Compare Operating Margin to Gross Margin
The gap between gross margin and operating margin reveals operational efficiency:
A $55M distributor:
- Gross margin: 28%
- Operating margin: 7%
- Gap: 21 points (operating expenses)
A $55M manufacturer:
- Gross margin: 34%
- Operating margin: 14%
- Gap: 20 points (operating expenses)
The manufacturer converts more gross margin to operating margin through lower relative operating expenses. Both companies have similar overhead, but the manufacturer's higher gross margin provides more buffer.
A widening gap (gross margin stable, operating margin declining) signals operating expense creep consuming profitability.
5. Benchmark Operating Expenses
Operating margin problems stem from either gross margin issues or operating expense issues. Isolate which:
Operating expenses as % of revenue:
- Manufacturing: 15-22%
- Distribution: 18-25%
- Professional Services: 35-50%
If your operating expenses fall within these ranges but operating margin is poor, the problem is gross margin. If operating expenses are excessive, overhead is the issue.
Is Your Operating Margin Good Enough?
Knowing whether your operating margin is "good" compared to industry targets provides useful context. The more actionable question is: what's preventing you from achieving good margins?
Most companies have margin improvement opportunities hiding in transaction data:
- Pricing below thresholds on specific products or customers
- Cost increases not passed through systematically
- Operating expenses growing faster than revenue
- Product mix drifting toward lower-margin items
- Unprofitable customers receiving high-touch service
- Discounting patterns that were temporary but became permanent
Finding these opportunities requires analyzing performance at the product, customer, and time-period level. For companies with thousands of SKUs and hundreds of customers, Excel becomes unwieldy.
That's what Pryse is built for. Upload your transaction data and see exactly where your margin is going—and where it could be better—in 24 hours, not 6 months.
For more on profitability benchmarks, see our guides on good net profit margins, good gross margins, and complete profit margins by industry.
Sources:
- What Is A Good Operating Profit Margin? The 2025 Answer - TrueProfit
- Industry Benchmarks of Gross, Net and Operating Profit Margins - Vena Solutions
- Operating and Net Margins - NYU Stern
- Profit Margin by Industry - FullRatio
- Operating (EBIT) Margin - FullRatio
- The Power of Pricing - McKinsey Quarterly
Last updated: February 24, 2026
Frequently Asked Questions

Want to analyze your entire product catalog?
Pryse automatically identifies margin leakage across thousands of SKUs. Upload your data and find hidden profit in 24 hours.
One-time $1,499 diagnostic. No subscription required.