What Is a Good Profit Margin for a Service Business? Benchmarks by Industry
A good profit margin for service businesses ranges from 10-30% net margin depending on type. Consulting hits 15-30%, cleaning 10-28%, HVAC 10-25%.
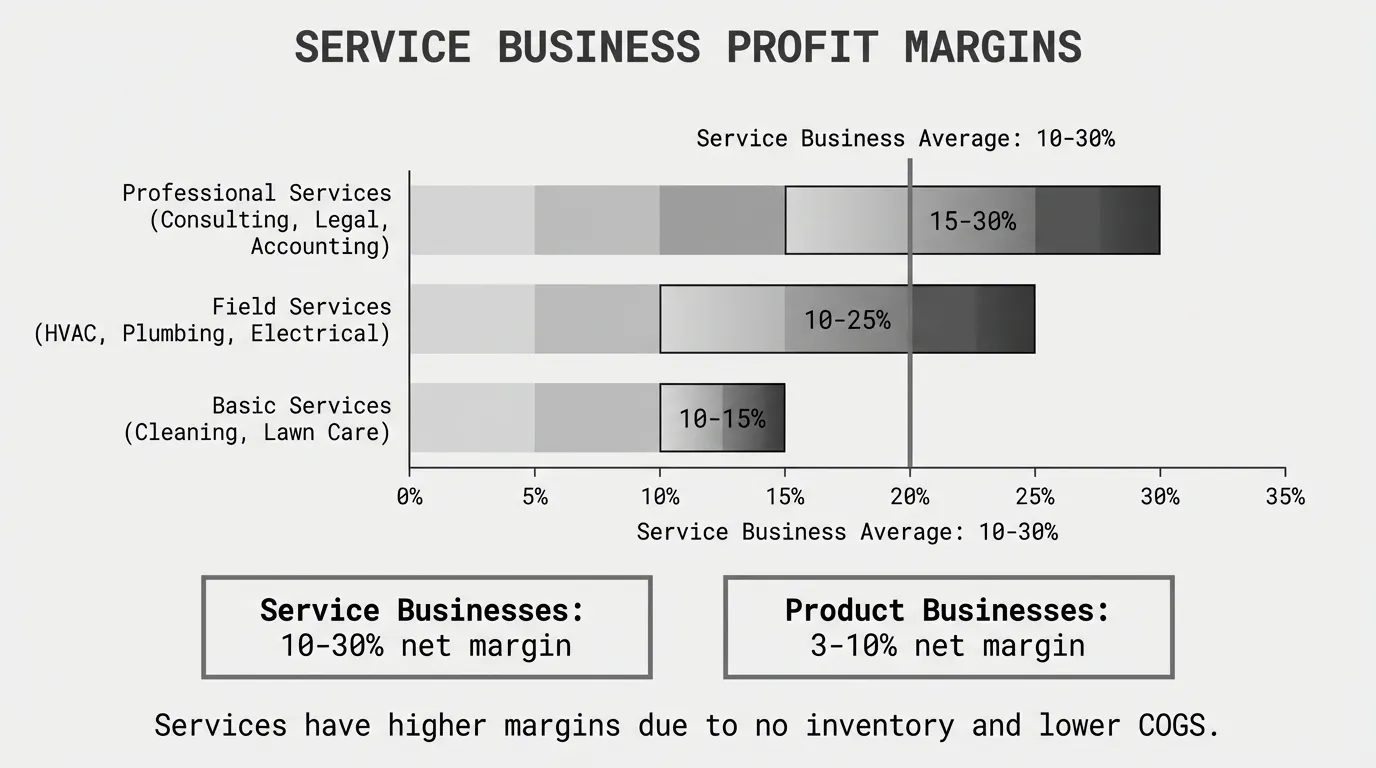
A good profit margin for a service business ranges from 10% to 30% net margin, depending on the type of service. Professional services like consulting, accounting, and legal average 15% to 30%. Field services like HVAC, plumbing, and electrical average 10% to 25%. Basic services like cleaning and lawn care average 10% to 15%.
The service industry average profit margin is around 30% according to Precursive's professional services benchmarking, but this varies significantly by service type, business model, and overhead structure.
Why Service Businesses Have Higher Margins Than Product Businesses
Service businesses typically operate at higher profit margins than product-based businesses. The structural reasons are clear:
No inventory costs. You're not buying products, warehousing them, managing shrinkage, or dealing with obsolescence. Your COGS is mostly labor and materials directly tied to delivered services.
Lower direct costs. Service businesses typically have COGS of 30-50% of revenue (mostly labor), compared to product businesses at 60-80% of revenue. This creates gross margins of 50-70% for services versus 20-40% for products.
Scalability without proportional costs. Adding another consulting client doesn't require buying more inventory or warehouse space. Your marginal cost per additional client is often just incremental labor time.
Value pricing opportunity. Services are harder to commoditize than products. A consulting engagement, custom software build, or specialized repair service can command premium pricing based on expertise and outcomes, not just time spent.
According to Vena Solutions' industry benchmarking data, professional services achieve gross margins of 50-70% and net margins of 10-20%, while retail businesses operate at 25-35% gross margin and 3-7% net margin.
But high gross margin doesn't automatically mean high net margin. Service businesses still have overhead: salaries, rent, insurance, marketing, software, and administrative costs. A consulting firm with 65% gross margin might only deliver 18% net margin after covering all operating expenses.
Good Profit Margin for Professional Services
Professional services—consulting, accounting, legal, design, marketing, engineering—typically achieve the highest margins in the service sector. You're selling expertise and advice, not labor hours.
Healthy profit margins for professional services:
- Gross margin: 50-70%
- Net profit margin: 15-30%
According to Mosaic's consulting profitability benchmarks, consulting firms typically achieve operating profit margins of 15% to 30%. Deltek's 2025 professional services benchmarks show that healthy professional services firms maintain net profit margins between 15% and 30%, though this varies significantly based on firm size and market conditions.
More specifically by professional service type:
| Service Type | Gross Margin | Net Margin | Source |
|---|---|---|---|
| Management consulting | 60-75% | 20-30% | Industry reports |
| Accounting/tax services | 60-75% | 18-24% | Industry average |
| Legal services | 55-70% | 15-20% | Industry average |
| Engineering/technical consulting | 50-65% | 15-22% | Industry average |
| Marketing/advertising agencies | 45-60% | 10-15% | Industry average |
| Architecture firms | 50-60% | 12-18% | Industry average |
| IT consulting | 55-70% | 18-25% | Industry average |
A management consulting firm at 25% net margin is performing well. An accounting practice at 18% is healthy. A marketing agency at 12% is typical—agencies have higher overhead from creative talent and client acquisition costs.
According to ProjectCor's professional services margin analysis, gross margins above 60% are achievable when firms have proper project management visibility and tools. ERP Software Blog's 2025 service industry analysis confirms that firms in consulting and professional services command higher margins due to expertise-based pricing.
Why Some Professional Services Hit 30%+ Margins
Professional services firms that exceed 30% net margin share common traits:
Specialization drives premium pricing. A generalist business consultant might bill $150/hour. A supply chain consultant specializing in pharmaceutical distribution bills $350/hour. Same work hours, higher margin.
Recurring revenue reduces client acquisition costs. Firms with monthly retainers or long-term contracts spread acquisition costs across months or years of revenue. One-off project firms spend 10-20% of revenue on sales and marketing.
Leveraged staffing models. Partners bill at $400/hour. Junior staff cost $60/hour but bill at $180/hour. Margins come from the spread between what you pay people and what you bill them at.
Low overhead. Work-from-home consultants have minimal overhead. Prestigious downtown law offices pay $100+ per square foot. Same billing rates, different margins.
Good Profit Margin for Field Services
Field services—HVAC, plumbing, electrical, appliance repair, pest control—operate at lower margins than professional services. You're deploying labor and materials to customer locations, which creates higher direct costs and overhead.
Healthy profit margins for field services:
- Gross margin: 40-60%
- Net profit margin: 10-25%
More specifically by field service type:
| Service Type | Gross Margin | Net Margin | Source |
|---|---|---|---|
| HVAC service | 40-50% | 10-25% | Jobber, FieldEdge |
| Plumbing service | 40-55% | 10-20% | House Call Pro, Build-Folio |
| Electrical service | 45-55% | 12-22% | Industry average |
| Appliance repair | 45-60% | 15-25% | Industry average |
| Pest control | 50-65% | 18-28% | Industry average |
| Locksmith services | 50-70% | 20-30% | Industry average |
According to Jobber's HVAC profit margin guide, HVAC companies typically have gross profit margins of 30% to 50%, though the industry average net margin is 2.5-3.5% overall. However, successful HVAC businesses achieve 10% net margin (good performance) and 25% (exceptional performance). FieldEdge's HVAC profitability analysis confirms that service providers should target 50% gross profit per job.
For plumbing specifically, House Call Pro's plumbing profitability research and Build-Folio's 2026 plumbing margin data show that average net profit margins range from 10-20%. A healthy plumbing business should target 15-25% net profit margin after all expenses. Service-focused plumbing shops (80%+ service calls vs. new construction) can hit 30-40% net margins.
Margin varies significantly by service type within plumbing:
| Plumbing Service Type | Gross Margin |
|---|---|
| Service/repair calls | 40-55% |
| Drain cleaning | 50-70% |
| Water heater replacement | 25-35% |
| Remodel rough-in | 20-30% |
| New construction | 10-18% |
Why Field Service Margins Vary So Much
The difference between a 10% margin HVAC business and a 25% margin HVAC business usually comes down to:
Service mix. Maintenance and repair generate 40-50% margins. Installation and new construction generate 15-25% margins. Companies doing 70%+ service work have higher overall margins.
Labor efficiency. Technicians billing 75% of their available hours versus 50% makes a massive difference. Unbilled travel time, inefficient routing, and downtime destroy margins.
Parts markup. Some field service companies mark up parts 30%. Others mark up 100%+. A $200 part sold for $400 adds $200 to gross margin. The same part sold for $260 adds $60.
Overhead control. Lean field service companies run 20-25% overhead. Bloated ones run 35-40%. That's 10-15 points of net margin difference on the same revenue.
An important caveat from PlotPath's service business profitability analysis: Many HVAC companies thought they were running at a 25% margin, only to discover after full cost tracking that their real margin was closer to 7%. Most service businesses underestimate true costs by not tracking all labor, callbacks, vehicle expenses, and administrative time.
Good Profit Margin for Basic Services
Basic services—cleaning, lawn care, landscaping, moving, junk removal—operate at the tightest margins in the service sector. These are typically labor-intensive services competing on price in crowded local markets.
Healthy profit margins for basic services:
- Gross margin: 35-55%
- Net profit margin: 10-15%
More specifically by basic service type:
| Service Type | Gross Margin | Net Margin | Source |
|---|---|---|---|
| Cleaning services | 40-60% | 10-28% | Contractor Plus |
| Lawn care/landscaping | 35-50% | 10-14% | TrueProfit |
| Moving services | 35-45% | 8-12% | Industry average |
| Junk removal | 40-55% | 12-18% | Industry average |
| Pressure washing | 50-65% | 15-25% | Industry average |
| Window cleaning | 50-70% | 18-28% | Industry average |
According to Contractor Plus's cleaning business profitability analysis, cleaning service profit margins range from 10% to 28%, with specialized services like carpet cleaning or pressure washing earning more. TrueProfit's high-margin small business research confirms that cleaning operations can exceed 31% net margin in some cases, while landscaping crews typically hit 10-14%.
Why Basic Services Have Lower Margins
Basic service margins are compressed by structural factors:
High labor intensity. You can't scale without hiring more people. A cleaning business doing $500K in revenue needs roughly the same number of cleaners as one doing $1M—just more hours per week.
Limited pricing power. Customers perceive these services as commodities. A $120 house cleaning versus a $150 house cleaning feels like a big difference, even if the quality difference is significant.
Local competition. Barriers to entry are low. Anyone with basic equipment can start a lawn care or cleaning business, which creates constant pricing pressure.
Overhead relative to revenue. Vehicle costs, equipment, insurance, and administrative time consume a higher percentage of revenue for basic services than for professional services.
That said, specialized basic services command higher margins. A standard residential cleaning service might hit 12% net margin. A medical office or post-construction cleaning service hits 20%+ because of specialized training, equipment, and lower price sensitivity.
Good Profit Margin for Healthcare Services
Healthcare-related service businesses—dental practices, physical therapy, optometry, veterinary services—operate in a regulated environment with insurance billing complexity, but often achieve strong margins.
Healthy profit margins for healthcare services:
- Gross margin: 45-65%
- Net profit margin: 12-30%
More specifically by healthcare service type:
| Service Type | Gross Margin | Net Margin | Source |
|---|---|---|---|
| Dental practices (general) | 60-70% | 30-40% | PorterKinney, Overjet |
| Dental specialty (ortho, oral surgery) | 65-75% | 40%+ | PorterKinney |
| Physical therapy | 50-60% | 15-25% | Industry average |
| Optometry practices | 55-65% | 18-28% | Industry average |
| Veterinary practices | 50-65% | 12-20% | Industry average |
| Chiropractic practices | 55-70% | 20-30% | Industry average |
According to PorterKinney's dental practice benchmarking data and Overjet's 2025 dental practice profit margin analysis, most dental practices maintain profit margins between 30% and 40% of total revenue. However, the average net profit margin is 12.9% after owner salaries, with a goal of 30% or more to achieve a highly profitable practice.
General dentistry typically falls within the 30-40% range, while orthodontics and oral surgery frequently exceed 40% due to higher case values and specialized procedures. Dentrix Magazine's dental profitability guide confirms that healthy dental practices achieve profit margins of 40% or higher, meaning total overhead stays below 60% of gross revenue.
Key expense benchmarks for dental practices:
- Staff costs: 24-28% of collections
- Supplies: ~6% of revenue
- Lab fees: ~5% of revenue
- Facility costs: 8-12% of gross revenue
Dental Economics' 2024 DE/Levin Group Annual Practice Survey revealed that overhead costs are rising, with 64% of practices reporting increases and half seeing hikes of 10% or more. However, profit increased by 6.4%, indicating that growth is possible even amid rising costs.
Factors That Shift "Good" for Your Service Business
Industry benchmarks are starting points, not targets. Several factors push your reasonable margin up or down:
Business Model Differences
Recurring revenue pushes margins up. A consulting firm with monthly retainers or an HVAC company with maintenance contracts spreads client acquisition costs across months or years of revenue. One-off service providers spend 10-20% of revenue on sales and marketing for each transaction.
Value-based pricing versus time-and-materials. Billing by the hour caps your revenue at hours worked times hourly rate. Value-based pricing (fixed price based on outcome) can double margins on the same work if you're efficient.
Leveraged versus owner-operator models. A solo consultant billing $200/hour at 1,500 billable hours generates $300K revenue. A consulting firm with five consultants billing $180/hour each generates $1.35M revenue. Margins come from the spread between what you pay people and what you bill them at.
Market Position Factors
Specialization commands premium margins. A general business consultant might hit 15% net margin. A consultant specializing in FDA compliance for medical device manufacturers hits 25%+ because of expertise scarcity and high client stakes.
Geographic market matters. A plumber in a rural area with limited competition can charge premium rates. A plumber in a saturated urban market faces constant price pressure. Same work, different margins.
Customer concentration affects stability. A marketing agency with 60% of revenue from one client has pricing risk. That client renegotiates hard. An agency with 20 clients at 5% each has pricing power.
Operational Efficiency Factors
Utilization rate drives margins. Service businesses succeed or fail based on billable hours as a percentage of available hours. A consultant billing 60% of their time versus 40% doubles revenue on the same cost base.
Overhead control separates good from great margins. Two HVAC companies with identical 45% gross margins can have very different net margins—one at 18% and one at 8%—based purely on overhead management.
Technology and automation. Service businesses that automate scheduling, billing, and client communication reduce administrative overhead from 15-20% of revenue to 8-12%. That's 7-12 points of margin improvement.
Warning Signs Your Profit Margin Is Too Low
A below-benchmark profit margin in a service business usually points to specific problems:
1. Underpricing based on competition instead of value. You're charging what competitors charge, not what your service is worth to clients. A consultant saving a client $500K annually but billing $50K for the engagement is leaving margin on the table.
2. Inefficient labor utilization. Your team spends 50% of time on billable work, 20% on admin, 15% on sales, and 15% on downtime. Elite service businesses hit 70%+ billable time through better processes and tools.
3. Unbilled time and scope creep. You estimate 40 hours for a project, bill for 40 hours, but actually spend 60 hours. That's 33% margin erosion on that project. Multiply across all projects and profitability collapses.
4. Poor project or job estimation. Field service companies that bid fixed-price jobs based on optimistic estimates (4 hours of work that actually takes 7 hours) destroy margins. Estimating errors compound quickly.
5. High overhead relative to revenue. Your office lease, insurance, software, and administrative staff cost 40% of revenue. Competitors run at 25%. That's 15 points of net margin difference on the same gross margin.
6. Customer acquisition cost too high. You spend $5,000 acquiring a customer who generates $8,000 in lifetime revenue. That's a 62.5% CAC-to-LTV ratio—unsustainable. Healthy service businesses target 20-30% CAC-to-LTV.
According to McKinsey's 2003 study "The Power of Pricing" published in McKinsey Quarterly, a 1% price improvement drives an 8% increase in operating profit for B2B service companies. For service businesses operating at 15-20% net margin, a 2-3% margin leak represents a 10-15% reduction in profitability.
How Service Businesses Can Improve Profit Margins
If your margin is below industry benchmarks, here are the highest-impact fixes:
1. Switch from Hourly to Value-Based Pricing
Stop billing by the hour. Bill based on the value delivered to the client. A consultant who saves a manufacturing client $200K annually through margin analysis shouldn't bill $150/hour for 100 hours ($15K). They should bill $40K-$60K based on outcome value.
This works for most service types:
- HVAC companies sell comfort and reliability, not hours
- Accountants sell tax savings and compliance peace of mind, not time spent
- Plumbers sell emergency response and problem resolution, not wrench time
2. Increase Billable Hour Utilization
Track every hour your team works. Categorize as billable, sales/marketing, admin, or downtime. Target 65%+ billable for service businesses, 75%+ for professional services.
Fixes that improve utilization:
- Automate scheduling and routing for field services
- Use project management software to eliminate coordination overhead
- Hire admin staff to handle non-billable work so technicians/consultants stay billable
- Batch administrative tasks instead of context-switching throughout the day
3. Fix Your Service Mix
Not all services generate equal margin. A plumbing company makes 50-70% gross margin on drain cleaning and 10-18% on new construction. An HVAC company makes 40-50% on maintenance and repair, 15-25% on installations.
Analyze margin by service type. Then:
- Market the high-margin services more aggressively
- Train sales on selling high-margin work
- Consider dropping or outsourcing low-margin services
- Require higher minimum project sizes for low-margin work
4. Reduce Scope Creep and Unbilled Time
Implement clear scoping and change order processes:
- Define scope precisely in contracts
- Track actual hours versus estimated hours by project
- Bill for scope changes immediately, not at project end
- Review estimation accuracy monthly and adjust future estimates
For field services: track truck rolls, callbacks, and warranty work separately. These are profit killers if not measured and managed.
5. Control Overhead Aggressively
Benchmark your overhead as a percentage of revenue against industry standards. If you're above benchmark, find the culprits:
- Expensive office space you don't need
- Redundant software subscriptions
- Overstaffed administrative functions
- Company vehicles sitting idle
- Insurance policies that aren't competitively bid
Cut overhead from 35% of revenue to 25% and you add 10 points to net margin.
6. Implement Recurring Revenue Models
One-time service revenue requires constant sales and marketing. Recurring revenue spreads acquisition costs over months or years:
- HVAC maintenance contracts
- Consulting retainers
- Managed services agreements
- Subscription-based access to expertise
A $500/month maintenance contract that costs $150/month to deliver generates $350/month margin (70% margin) with near-zero additional sales cost after year one.
What to Do Next
If you run a service business with $500K+ in revenue and you're not sure whether your profit margin is good, here's what to do:
-
Calculate your margins consistently. Make sure you're measuring gross margin and net margin the same way industry benchmarks do. Include all labor costs (including your own time) in COGS.
-
Compare to direct competitors in your service niche. An IT consulting firm shouldn't compare to lawn care. Find 3-5 businesses in your specific service type and benchmark against them.
-
Track billable utilization. Measure billable hours as a percentage of available hours. This is the single biggest margin driver for service businesses.
-
Segment your analysis by service type. Calculate margin by service line, not just overall. Your 18% overall margin might be hiding 35% margin on consulting and 8% margin on implementation.
-
Find your margin leakage. Where is margin going? Underpricing? Inefficient labor? Scope creep? Overhead bloat? Unbilled time?
For service businesses managing dozens of clients and projects across months of work, tracking profitability in Excel becomes unwieldy. Margin analysis that should take a day takes weeks—so it doesn't happen.
For service businesses with transaction-based or project-based revenue, Pryse can help. Upload your transaction or project data and see where your margin actually goes in 24 hours. Built for mid-market businesses who need insights fast.
For industry-specific benchmarks beyond service businesses, see our complete guide to profit margins by industry.
Sources
- Precursive: Ideal Profit Margins For Service Businesses
- Vena Solutions: Industry Benchmarks of Gross, Net and Operating Profit Margins
- Mosaic: Consulting Firm Profitability Benchmarks
- Deltek: 2025 Professional Services Benchmarks
- ProjectCor: Ideal Gross Profit Margin in Professional Services
- ERP Software Blog: Typical Profit Margins in Services Industry
- Jobber: HVAC Business Profit Margins Guide
- FieldEdge: HVAC Profit Margins
- House Call Pro: Plumbing Business Profitability
- Build-Folio: Plumbing Business Profit Margins (2026)
- Contractor Plus: Is Cleaning Business Profitable?
- TrueProfit: High Profit Margin Small Businesses
- PlotPath: What's Your Real Profit Margin?
- PorterKinney: Dental Practice Financial Benchmarks
- Overjet: Average Dental Practice Profit Margin (2025)
- Dentrix Magazine: Good Profit Margin for Dental Practice
- Curve Dental: Average Dental Practice Revenue
- McKinsey: The Power of Pricing (2003)
Last updated: February 24, 2026
Frequently Asked Questions

Want to analyze your entire product catalog?
Pryse automatically identifies margin leakage across thousands of SKUs. Upload your data and find hidden profit in 24 hours.
One-time $1,499 diagnostic. No subscription required.