Customer Profitability Analysis: Find Your Most and Least Profitable Customers
Calculate customer profitability using revenue, COGS, and cost-to-serve. Learn the whale curve and what to do with unprofitable accounts.
Customer profitability analysis is a method that calculates the true profit generated by each customer or customer segment by attributing both revenue and all associated costs to individual accounts.
Customer Profit = Customer Revenue - Customer COGS - Cost-to-ServeThe calculation goes beyond gross margin. Two customers buying $500,000 per year can have wildly different profitability if one demands rush shipping, takes 60-day payment terms, and calls your support team weekly while the other orders in bulk, pays in 15 days, and handles their own problems.
Why Customer Profitability Analysis Matters
Most companies know their overall margins. Few know which customers actually make them money.
The assumption that your biggest customers are your most profitable ones is often wrong. Large accounts negotiate harder, demand more services, and consume more support resources. Without analyzing profitability at the customer level, you're flying blind on where to focus sales efforts, which accounts deserve premium service, and which relationships are quietly bleeding margin.
For distribution and manufacturing companies with hundreds of accounts, this analysis regularly uncovers that 20-30% of customers are unprofitable—and the company didn't know it.
The Whale Curve: What Customer Profitability Actually Looks Like
The whale curve is a visualization of cumulative customer profitability ranked from highest to lowest. It's called a whale curve because the shape resembles a whale's head and body when plotted.
According to Harvard professors Robert Kaplan and V.G. Narayanan, the traditional 80/20 rule understates the concentration of customer profitability. Their research found that the most profitable 20% of customers typically generate between 150% and 300% of total profits.
Here's how profits distribute across a typical customer base:
| Customer Segment | Share of Customers | Contribution to Profit |
|---|---|---|
| Profit makers | Top 20% | 150-300% of total profit |
| Breakeven | Middle 60% | ~0% (wash) |
| Profit losers | Bottom 20% | Lose 50-80% of total profit |
The math works because the bottom segment's losses offset part of the top segment's gains, leaving you with 100% of actual profit.
A Swedish heating systems manufacturer ran this analysis and found their top 20% of customers generated 225% of profits, 70% broke even, and 10% caused a loss of 125% of profits. The surprise: their two largest-volume customers were also their least profitable.
The Customer Profitability Formula
Gross margin only accounts for product cost. Customer profitability accounts for everything required to serve that account.
Customer Profitability = Customer Revenue - Customer COGS - Cost-to-Serve
Cost-to-Serve = Freight + Returns + Support + Order Processing + Payment Terms Cost + Special Handling
Breaking Down Cost-to-Serve Components
Freight and delivery costs
What you spend getting products to the customer. Includes LTL/TL shipping, last-mile delivery, expedited shipping charges, and fuel surcharges you absorb. A customer demanding next-day delivery on small orders costs far more to serve than one accepting weekly consolidated shipments.
Returns processing
The cost of handling returned merchandise: inspection, restocking, damaged goods write-offs, and return shipping you cover. High-return customers erode margin quickly even if their gross margin looks healthy.
Customer support time
Hours spent on order inquiries, technical support calls, complaint handling, and custom requests. Track this by customer if you can. Some accounts consume 10x the support of others at the same revenue level.
Order processing labor
Cost of entering orders, handling exceptions, coordinating with the warehouse, and managing backorders. Customers placing frequent small orders with special instructions cost more to process than those placing large standard orders monthly.
Payment terms carrying cost
The cost of financing receivables. A customer on 60-day terms costs you the interest on that capital for two months. At 7% annual financing cost, 60-day terms cost you 1.15% of the invoice value. That comes straight out of margin.
Special handling requirements
Custom packaging, labeling, EDI setup, consignment inventory, dedicated storage, compliance documentation. These costs are real and should be allocated to the customers requiring them.
How to Calculate Customer Profitability: A Worked Example
A $65M electrical distributor wants to analyze profitability for a major account.
Customer data:
- Annual revenue: $420,000
- Cost of goods sold: $336,000 (80% of revenue)
- Gross profit: $84,000 (20% gross margin)
Cost-to-serve breakdown:
- Freight absorbed: $18,500 (customer expects free delivery on all orders)
- Returns processing: $6,200 (12% return rate vs company average of 4%)
- Support time: $8,400 (estimated 200 hours × $42/hour loaded cost)
- Order processing: $4,800 (400 orders × $12 average processing cost)
- Payment terms cost: $3,150 (60-day terms on $420K at 7.5% cost of capital)
- Special requirements: $2,100 (custom labeling)
Total cost-to-serve: $43,150
Customer Profit = $84,000 - $43,150 = $40,850
Customer Profit Margin = $40,850 / $420,000 = 9.7%
This customer looked like a 20% gross margin account. After cost-to-serve, they're actually a 9.7% profit margin account—less than half what the gross margin suggested.
Compare this to another customer doing $420,000 with the same 20% gross margin but minimal cost-to-serve:
- Freight absorbed: $4,200 (picks up at warehouse)
- Returns: $800 (low return rate)
- Support time: $1,680 (40 hours)
- Order processing: $1,440 (120 orders)
- Payment terms: $788 (15-day terms)
- Special requirements: $0
Total cost-to-serve: $8,908
Customer Profit = $84,000 - $8,908 = $75,092 (17.9% margin)Same revenue. Same gross margin. One customer generates $75K in profit. The other generates $41K. That's an $34K difference you'd never see looking only at gross margin.
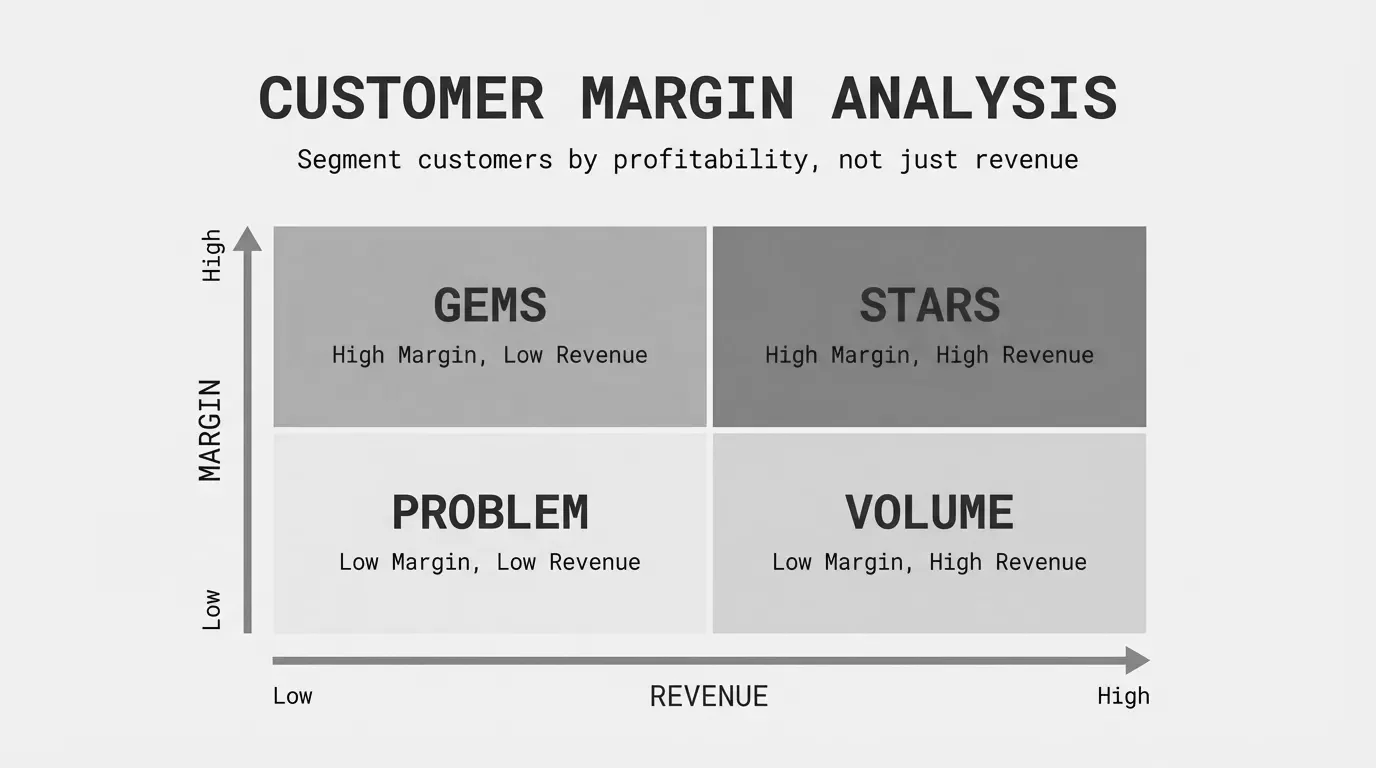
The Customer Profitability Matrix
Once you've calculated profitability, segment customers into four quadrants:
| High Margin | Low Margin | |
|---|---|---|
| High Volume | Protect and grow | Reprice or reduce cost-to-serve |
| Low Volume | Maintain or develop | Restructure or exit |
High volume, high margin (top right): Your best customers. Protect these relationships. Invest in service. Don't give them reasons to shop competitors.
High volume, low margin (top left): Often your biggest accounts by revenue. They negotiated hard, demand lots of service, and know you depend on their volume. These need attention—either reprice, reduce service costs, or accept the strategic value if you can articulate it.
Low volume, high margin (bottom right): Good customers who could be great with more volume. Develop these relationships. They've proven they'll pay fair prices.
Low volume, low margin (bottom left): Question why you serve them. Unless they're growing or strategic, these accounts drain resources from profitable relationships.
What to Do With Unprofitable Customers
Finding unprofitable customers is step one. Fixing them is step two.
Option 1: Reprice the relationship
Raise prices to cover true cost-to-serve. This is uncomfortable but often necessary. Frame it around the services you provide: "Given the shipping frequency and support level we provide, we need to adjust pricing to continue this service level."
Option 2: Reduce cost-to-serve
Change how you serve them. Consolidate shipments. Require minimum order sizes. Move to phone/email support instead of dedicated reps. Charge for rush orders. Shift payment terms from net-60 to net-30.
Option 3: Enforce existing terms
Many unprofitable customers got that way because policies weren't enforced. Free freight that was supposed to require $500 minimums. Payment terms that stretched from 30 to 60 days without anyone noticing. Start enforcing what was already agreed.
Option 4: Convert their behavior
Some customers don't realize how their ordering patterns affect your costs. Show them. "If you combined your five weekly orders into one, we could reduce the price by 3%." Many will change if given an incentive.
Option 5: Fire the customer
Sometimes the math doesn't work no matter what you do. A customer with $50K in revenue and $15K in losses is costing you $65K in opportunity cost versus serving a breakeven account. Not every customer deserves your business.
Running the Analysis for Your Company
Most ERPs have the sales data but lack cost-to-serve allocation. You'll need to:
- Export transaction data - Revenue and COGS by customer
- Allocate freight - Match shipping costs to customer orders
- Estimate support time - Survey your team or pull from CRM if tracked
- Calculate order processing - Orders per customer × cost per order
- Compute payment terms cost - DSO by customer × cost of capital
- Assign special costs - Any customer-specific expenses
For companies with 500+ customers and 10,000+ transactions, this gets tedious in spreadsheets. The data exists in your ERP—the challenge is pulling it together and keeping it current.
The Hidden Opportunity
Distribution and manufacturing companies typically find 3-7 points of margin hiding in customer profitability analysis. Not from raising prices across the board, but from fixing the specific customers and behaviors that drain profit.
If one analysis of your customer base reveals that 20% of accounts are underwater, and fixing or exiting half of those recovers $150K annually, the work pays for itself fast.
For the complete picture of where margin hides in your business, see our complete guide to margin analysis. Customer profitability is one piece—you'll also want to look at product-level margins, pricing consistency, and the full pocket price waterfall.
Last updated: January 21, 2026
Frequently Asked Questions

Want to analyze your entire product catalog?
Pryse automatically identifies margin leakage across thousands of SKUs. Upload your data and find hidden profit in 24 hours.
One-time $1,499 diagnostic. No subscription required.