Price Analysis Software: Buyer's Guide for Distribution & Manufacturing
Compare price analysis tools for mid-market companies. Features, costs, and when analysis tools deliver better ROI than optimization platforms.
Price analysis software allows companies to analyze pricing patterns, compare prices to competitors, calculate margins by product and customer, and identify underpriced items or excessive discounts without the complexity or cost of full pricing optimization platforms.
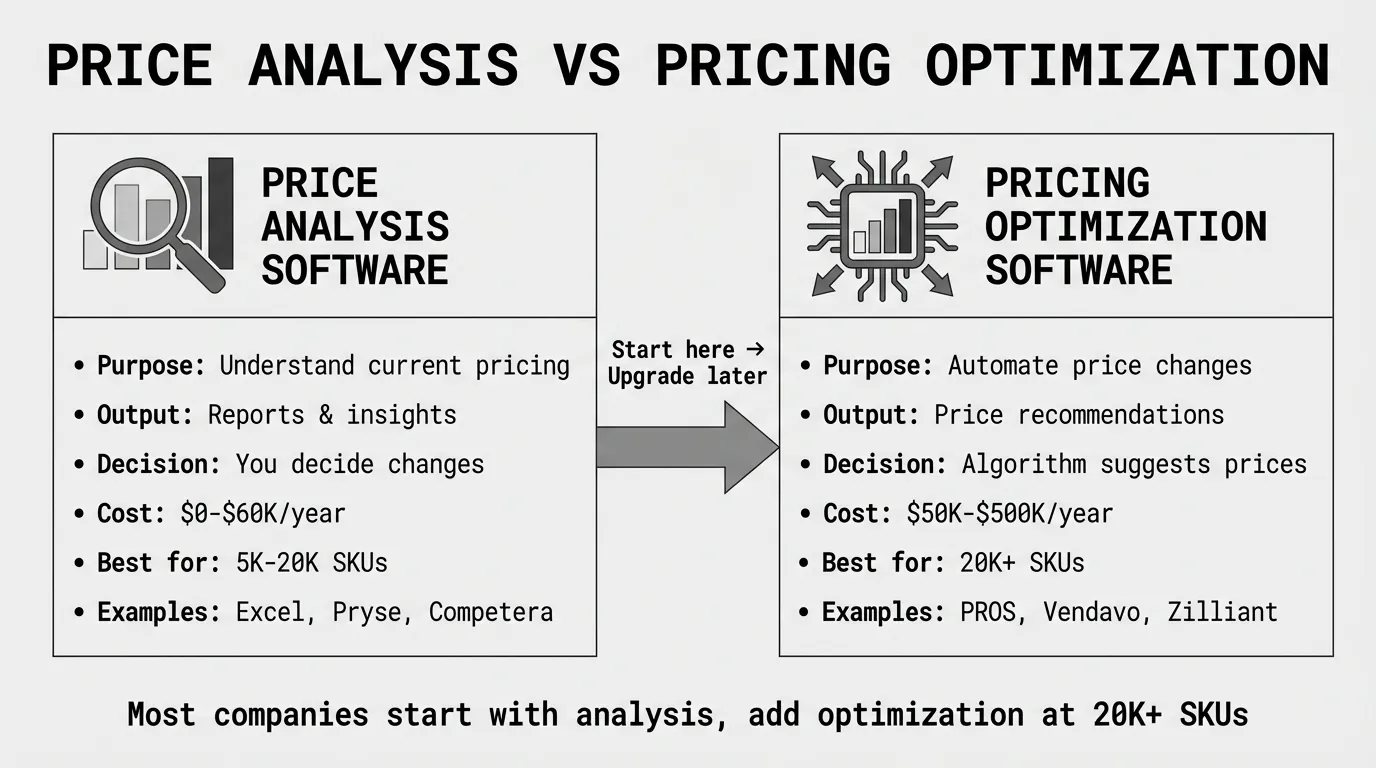
The key distinction: price analysis is observational and diagnostic, while pricing optimization is prescriptive and automated. Analysis tools help you understand your current pricing performance, while optimization tools use that understanding to automatically set new prices.
For mid-market distribution and manufacturing companies, price analysis software typically delivers better first-year ROI than optimization platforms because it costs 50-70% less, implements in weeks instead of months, and identifies the same margin improvement opportunities without requiring AI infrastructure or pricing teams.
This guide covers what price analysis software does, how it differs from pricing optimization, when analysis alone is sufficient, and which tools match your company size and pricing complexity.
What Price Analysis Software Does
Price analysis software ingests transaction data from your ERP system and produces reports showing pricing patterns, margin performance, and opportunities for improvement.
Core analysis capabilities:
- Margin analysis: Calculate gross margin, net margin, and pocket margin by SKU, customer, product category, sales rep, or any dimension in your data
- Price positioning: Compare your prices to competitors, market averages, or internal benchmarks to identify overpriced or underpriced items
- Discount analysis: Track discount patterns by customer, product, or time period to identify excessive discounting or margin erosion
- Price waterfall visualization: Show how list price erodes to pocket price through invoice discounts, rebates, freight absorption, and other deductions
- Trend analysis: Monitor how prices, costs, and margins change over time to spot problems before they compound
What analysis software typically doesn't include:
- Automated price recommendations (that's optimization)
- Real-time pricing updates based on market conditions
- AI and machine learning for elasticity modeling
- Automatic price changes pushed back to your ERP
- Complex scenario modeling for "what if" analysis
The line between analysis and optimization has blurred as vendors add features, but the core distinction remains: analysis tells you what's happening, optimization tells you what to do about it.
Price Analysis vs Pricing Optimization: Key Differences
Understanding the distinction helps you choose the right tool category and avoid paying for capabilities you don't need.
Price Analysis Software
What it does: Shows how your prices compare to competitors and reveals margin patterns across products, customers, and time periods.
Primary output: Reports, dashboards, and visualizations showing pricing performance
Decision-making: You review analysis and manually decide price changes
Typical cost: $0 (Excel) to $60K annually for mid-market platforms
Implementation: Days to weeks for diagnostics; 1-3 months for platforms
Best for: Companies that need to understand pricing problems before investing in automation, or those with straightforward pricing that doesn't require continuous optimization
According to SurveyMonkey's price analysis guide, a price analysis helps you correctly estimate a product's price so that it's attractive enough for consumers to become your customers, serving as the foundation for informed pricing decisions.
Pricing Optimization Software
What it does: Uses mathematical analysis and machine learning to predict how customers respond to different prices, then recommends or automatically sets optimal prices
Primary output: Recommended price changes with projected impact on revenue and margin
Decision-making: Algorithm recommends prices based on elasticity models, competitor moves, and business rules
Typical cost: $50K to $500K annually for enterprise platforms
Implementation: 6-18 months including data integration, model training, and change management
Best for: Companies with 20,000+ SKUs, frequent price changes, and dedicated pricing teams
As Wikipedia's price optimization article explains, price optimization utilizes data analysis to predict the behavior of potential buyers to different prices of a product or service, going beyond simple analysis to prescriptive recommendations.
When to Choose Analysis Over Optimization
Choose price analysis software if:
- You're using Excel today and haven't done systematic margin analysis
- Your pricing is relatively stable (quarterly or semi-annual price list updates)
- You have under 10,000 SKUs
- Budget is constrained to under $60K annually
- You don't have a dedicated pricing team to manage optimization software
- You want to quantify margin opportunities before investing in optimization
Choose pricing optimization software if:
- You've exhausted manual analysis and need automation for 20,000+ SKUs
- Prices change frequently based on competitor moves or market conditions
- You have dedicated pricing resources (2+ FTEs)
- Clear ROI exists from 2-5% margin improvement on $100M+ revenue
- You can allocate 6-18 months for implementation
Many companies start with price analysis to quantify opportunities, then upgrade to optimization once they've proven ROI and built organizational readiness.
Types of Price Analysis Software
Price analysis capabilities span from free Excel templates to enterprise analytics platforms. Understanding the categories helps you match tool sophistication to your actual needs.
Excel-Based Analysis (Free)
Best for: Companies with under 5,000 SKUs, first-time margin analysis, budget constraints
What you get:
- Export transaction data from ERP to Excel
- Build pivot tables showing margin by product, customer, and category
- Create charts visualizing price trends and discount patterns
- Identify top underpriced products using simple formulas
Cost: $0 (free)
Time investment: 10-40 hours to build initial analysis templates
Limitations: Doesn't scale beyond 10,000 rows efficiently, no automation, requires manual data exports, prone to formula errors
See our margin analysis in Excel guide for step-by-step instructions.
Self-Serve Diagnostics ($1K-$5K one-time)
Best for: Companies wanting professional analysis without ongoing subscriptions, first comprehensive margin review
Examples: Pryse ($1,499)
What you get:
- Upload transaction CSV from your ERP
- Receive professional margin analysis within 24-48 hours
- Price waterfall visualization showing margin erosion
- Top margin leakage sources ranked by dollar opportunity
- Specific recommendations for quick wins
Cost: $1,499 one-time (Pryse)
Time investment: 1-2 hours to prepare CSV export
When it makes sense: You need comprehensive analysis but can't justify $20K+ annual subscriptions, or you want to quantify opportunities before investing in ongoing software.
Most companies recover 3-10x the diagnostic cost by implementing top recommendations.
Mid-Market Analysis Platforms ($20K-$60K annually)
Best for: 5,000-20,000 SKUs, repeatable analysis workflows, no optimization needed yet
Examples: Competera Analytics (analysis-only tier), Vistaar Analytics, regional pricing consultancies with analysis tools
What you get:
- Automated data ingestion from ERP via CSV uploads
- Pre-built dashboards showing margin by key dimensions
- Competitor price tracking and comparison
- Discount analysis and approval workflows
- Price waterfall and margin bridge reports
- Historical trend analysis
- User access controls and report scheduling
Cost: $20K-$60K annually depending on SKU count and user seats
Implementation: 1-3 months for setup, training, and initial analysis
When it makes sense: You've confirmed $200K+ in recoverable margin through diagnostics, need repeatable monthly or quarterly analysis, and have outgrown Excel but don't need full optimization.
According to CRO Club's 2026 pricing software review, mid-market pricing software directly and positively impacts a company's financial performance by enabling optimized pricing decisions and identifying revenue opportunities.
Enterprise Analysis + Optimization Platforms ($50K-$500K annually)
Best for: 20,000+ SKUs, optimization capabilities needed, enterprise scale
Examples: Pricefx (analytics module), Vendavo (profit analyzer), Zilliant (price IQ), PROS (pricing analytics)
What you get:
- Everything in mid-market platforms plus:
- Live ERP integration with continuous data sync
- Advanced analytics including price elasticity and customer segmentation
- AI-powered insights identifying hidden patterns
- Scenario modeling for "what if" analysis
- Optimization recommendations (if you enable those modules)
- API access for custom reporting
Cost: $50K-$500K annually depending on modules, SKUs, and whether you include optimization
Implementation: 3-12 months
When it makes sense: You operate at enterprise scale, need both analysis and optimization, or require advanced features like live ERP integration and elasticity modeling.
Note that enterprise platforms typically offer analysis-only configurations at lower price points before adding optimization modules.
Competitor Price Intelligence Tools ($5K-$40K annually)
Best for: Commodity distributors, retail, ecommerce with frequent competitor price changes
Examples: Prisync, Priceva, Competera (competitor tracking module)
What you get:
- Automated competitor price scraping from websites and marketplaces
- Price comparison reports showing your position vs competitors
- Alerts when competitor prices change
- Historical competitor pricing trends
- Market average calculations by product category
Cost: $5K-$40K annually depending on SKU count and scraping frequency
Implementation: 1-4 weeks
When it makes sense: Your pricing follows competitor moves closely (commodity distribution), you sell on marketplaces where competitor prices are public, or you need daily competitive intelligence.
Prisync is a well-regarded AI-powered platform that makes competitor price tracking fast, precise, and fully automated, used by companies from SMBs to Fortune 500 brands for price and stock availability data.
Key Features to Look For
Not all price analysis software includes these capabilities. Prioritize features based on your specific pricing challenges.
Essential Features (Required)
Margin calculation by key dimensions:
- Calculate gross margin, net margin, or pocket margin
- Slice by product, customer, sales rep, region, or any ERP field
- Year-over-year and period-over-period comparisons
Data import/export:
- CSV upload from ERP (standard format)
- Export analysis results for presentation or further analysis
- Support for 12-24 months of transaction history
Price waterfall visualization:
- Shows list price → invoice price → pocket price progression
- Identifies where margin leaks (discounts, rebates, freight, terms)
- Quantifies dollar impact of each waterfall component
Valuable Features (Nice to Have)
Discount pattern analysis:
- Tracks discounts by customer, product, or time period
- Identifies customers with excessive discounting
- Flags inconsistent discount practices
Competitor price comparison:
- Shows your price vs competitor prices by product
- Calculates price gaps and positioning
- Trend analysis for competitive moves
Underpriced product identification:
- Flags products priced below cost or target margin
- Ranks opportunities by dollar impact
- Suggests pricing adjustments
Customer profitability analysis:
- Calculates net margin per customer after all costs
- Segments customers by profitability
- Identifies high-volume, low-margin relationships
Advanced Features (Enterprise Only)
Live ERP integration:
- Continuous data sync via API
- Real-time dashboard updates
- Automated report generation and distribution
Price elasticity analysis:
- Calculates how volume responds to price changes
- Requires sufficient transaction history and price variation
- Statistical rigor beyond basic analysis
Scenario modeling:
- "What if" analysis for proposed price changes
- Predicts impact on revenue, volume, and margin
- Compares multiple pricing scenarios side-by-side
Custom segmentation:
- Define customer or product segments using your business logic
- Analyze pricing and margins within segments
- Compare performance across segments
Price Analysis Software Market Leaders
Around the world in 2026, over 664 companies use pricing optimization software, with 328 from the United States, according to 6sense market analysis. Many of these platforms offer analysis-only configurations.
For Large Distributors: Vendavo Profit Analyzer
Best for: Distribution companies with 20,000+ SKUs, complex customer-specific pricing
Key strengths:
- Built specifically for B2B distribution pricing models
- Margin bridge analysis showing exactly where margin erodes
- Deal price guidance during negotiations
- Strong analytics for chemicals, building materials, industrial distribution
Analysis capabilities: Customer and product profitability, price waterfall, discount analysis, margin bridge, business risk alerts
Cost: Custom quotes, typically $100K+ annually for full platform but analysis-only configurations available at lower price points
Trade-offs: More expensive than pure analysis tools because it includes optimization capabilities you may not need initially
For Mid-Market B2B: Pricefx Analytics Module
Best for: Mid-market companies wanting analysis now, optimization later
Key strengths:
- Modular architecture allows you to start with analytics only
- Cloud-native platform with modern interface
- Scales from mid-market to enterprise as complexity grows
- Strong in manufacturing and distribution
According to Capterra's 2026 pricing software comparison, Pricefx holds 26.87% market share with 208 enterprise customers, offering flexible implementation that lets you start with price analysis and add optimization later.
Analysis capabilities: Price positioning, margin analytics, customer segmentation, competitive analysis, discount tracking
Cost: Estimated $50K-$100K annually for analytics module (less than full optimization platform)
For Ecommerce/Retail: Competera Analytics
Best for: Mid-market retail and ecommerce, commodity distributors, frequent price changes
Key strengths:
- Real-time competitor price tracking
- Mid-market pricing more accessible than enterprise platforms
- Good for commodity distributors facing daily price volatility
- Fast implementation (1-3 months)
Analysis capabilities: Competitive price intelligence, demand forecasting, price positioning analysis, markdown optimization analytics
Cost: $20K-$100K annually depending on SKU count
According to Orb's competitive pricing tools analysis, Competera provides real-time competitive pricing monitoring with AI-driven demand forecasting, making it effective for mid-market companies needing competitor intelligence without full optimization.
For Large SKU Catalogs: Zilliant Price IQ
Best for: B2B companies with 20,000-100,000+ SKUs, distribution and manufacturing
Key strengths:
- Purpose-built for massive SKU catalogs
- Strong analytics for identifying margin leakage patterns
- Price-volume-mix analysis
- Industry focus on chemicals, building materials, wholesale distribution
Analysis capabilities: Comprehensive margin analysis across 100,000+ SKUs, customer profitability, sales guidance analytics, price waterfall at scale
Cost: Custom quotes, comparable to enterprise platforms at $100K+ annually
Zilliant's pricing software incorporates advanced analytics and AI algorithms to provide companies with data-driven insights for effective pricing decisions.
For Self-Serve Diagnostics: Pryse
Best for: Companies using Excel today, first comprehensive margin analysis, not ready for subscriptions
Key strengths:
- Zero implementation (upload CSV, receive analysis in 24 hours)
- One-time cost, no subscription commitment
- Professional analysis without software complexity
- Quantifies margin leakage and dollar opportunity
Analysis capabilities: Margin analysis by SKU and customer, price waterfall visualization, top margin leakage sources, underpriced product identification
Cost: $1,499 one-time
When it makes sense: You want to quantify margin opportunities before investing in ongoing software, or you're a smaller company where one-time analysis plus targeted fixes is sufficient.
How to Choose Price Analysis Software
Match software sophistication to your actual pricing complexity, not your aspirations. Most companies overestimate their need for advanced features.
Decision Framework by Company Size
$5M-$20M revenue:
Excel or self-serve diagnostics deliver the best ROI. Export transaction data from your ERP, run margin analysis, identify top opportunities, implement fixes.
Start with Excel. If analysis becomes time-consuming (10+ hours monthly), consider a $1,499 diagnostic to get professional analysis without ongoing costs.
$20M-$100M revenue:
Self-serve diagnostics first to quantify opportunity, then mid-market analysis platforms if you need repeatable workflows.
Budget path: $1,499 diagnostic → implement top fixes → re-evaluate in 6 months → upgrade to $20K-$60K platform only if manual analysis becomes unmanageable.
$100M-$500M revenue:
Mid-market platforms or enterprise analytics modules depending on SKU complexity.
Budget $20K-$100K annually. Choose Competera or Vistaar for mid-market simplicity, or Pricefx/Vendavo analytics modules if you anticipate needing optimization within 12-24 months.
$500M+ revenue:
Enterprise analytics platforms with path to optimization.
Budget $50K-$200K annually for analytics, with understanding you'll likely add optimization modules as pricing team matures. Choose Pricefx, Vendavo, Zilliant, or PROS based on industry fit.
Decision Framework by SKU Count
Under 1,000 SKUs:
Excel is sufficient. Don't pay for analysis software until you've exhausted Excel capabilities.
1,000-5,000 SKUs:
Self-serve diagnostics ($1,499) provide professional analysis. Only upgrade to platforms if diagnostic reveals $100K+ recoverable margin and manual optimization becomes time-consuming.
5,000-20,000 SKUs:
Mid-market analysis platforms deliver ROI at this scale. Budget $20K-$60K annually.
20,000-50,000 SKUs:
Crossover point. Mid-market platforms work but you'll likely outgrow them. Consider enterprise analytics modules with path to optimization.
50,000+ SKUs:
Enterprise platforms required. You can't analyze 50,000+ SKUs effectively with mid-market tools. Budget $50K+ annually.
Decision Framework by Analysis Frequency
Annual price list reviews:
Excel or one-time diagnostics. You don't need software subscriptions for once-a-year analysis.
Quarterly price reviews:
Self-serve diagnostics or entry-level analysis platforms. Run diagnostics quarterly ($6K annually for 4 diagnostics) or invest in $20K-$40K platform for automated workflows.
Monthly analysis:
Mid-market platforms make sense. Repeatable workflows justify subscription costs.
Weekly or daily analysis:
Enterprise platforms with live ERP integration. Manual CSV exports don't scale to daily analysis needs.
Decision Framework by Current State
Still using Excel today:
Start with self-serve diagnostics to understand what professional analysis reveals before committing to subscriptions.
Path: Excel → diagnostic ($1,499) → evaluate results → mid-market platform only if justified by opportunity size and time savings.
Spreadsheet analysis becoming time-consuming:
Mid-market analysis platforms automate what you're doing manually. Calculate time savings: if you spend 10+ hours monthly on Excel analysis, a $20K-$40K platform pays for itself in time alone.
Already have pricing software but not using optimization features:
You're paying for capabilities you don't need. Downgrade to analysis-only tier or switch to pure analysis tools to reduce costs.
Have dedicated pricing team:
Enterprise analytics platforms with optimization path make sense. Your team has capacity to leverage advanced features.
No dedicated pricing resources:
Simpler is better. Self-serve diagnostics or basic analysis platforms deliver ROI without requiring pricing expertise.
Implementation Considerations
Software selection is 30% of success. Data quality and organizational readiness are 70%.
Data Requirements
All price analysis software requires transaction data from your ERP. Minimum dataset:
Required fields:
- SKU identifier and description
- Customer identifier
- Invoice price and quantity
- Cost (COGS)
- Transaction date
- 6-12 months of history (more is better)
Optional but valuable:
- Customer segment or region
- Product category or product line
- Sales rep or territory
- Discount codes or reason codes
- Freight charges
- Rebates and off-invoice deductions
Most distributors and manufacturers already have required data in their ERP. The challenge is exporting it in clean format.
Data Quality Issues to Fix First
Expect to spend time cleaning data before analysis, whether using Excel, diagnostics, or platforms:
Common problems:
- Duplicate SKU codes for same product
- Missing or incorrect cost data
- Test customers or internal transactions in production data
- Inconsistent product categorization
- SKUs with zero volume (discontinued but not removed)
Budget 5-20 hours for data preparation on first analysis. Subsequent analyses take less time once you've cleaned core master data.
Integration Options
Excel and diagnostics: No integration needed. One-time CSV export.
Mid-market platforms: Typically CSV-based workflows. Export transaction data monthly or quarterly, upload to platform, analyze results. Less IT complexity than live integration but requires manual effort.
Enterprise platforms: Live ERP integration via APIs. Requires IT resources for setup (50-200 hours) but eliminates ongoing manual exports. Only justified if analysis frequency is weekly or more.
Cost-Benefit Analysis
Price analysis software ROI comes from two sources: margin recovery and time savings.
Typical Margin Improvements from Analysis
Industry research and vendor case studies show:
Excel analysis: 0.5-1.5% margin improvement from fixing obvious problems
Self-serve diagnostics: 1-2% margin improvement from professional analysis identifying patterns you missed
Mid-market platforms: 1-3% margin improvement from systematic, repeatable analysis over time
Enterprise analytics: 2-4% margin improvement from advanced analysis capabilities (note: optimization adds another 1-2% on top of this)
Break-Even Scenarios
Self-serve diagnostic ($1,499 one-time):
Break-even requires recovering $15K-$50K margin. Any company with $5M+ revenue and pricing problems meets this threshold easily.
Example: A $30M distributor with 3% net margin ($900K) recovering just 0.5% margin improvement ($150K) gets 100x ROI from a $1,499 diagnostic.
Mid-market platform ($20K-$60K annually):
Break-even requires $100K-$300K margin recovery over 3 years at 1-3% improvement. This means $3M-$10M in annual cost of goods sold with identifiable margin problems.
Example: A $50M distributor with 25% gross margin ($12.5M COGS) improving margin by 1.5% recovers $188K annually. A $30K annual platform cost pays for itself in 2 months.
Enterprise platform ($50K-$200K annually for analytics only):
Break-even requires $250K-$1M margin recovery over 3 years at 2-4% improvement. This requires $10M+ in annual cost of goods sold with significant complexity.
Example: A $200M manufacturer with 30% gross margin ($60M COGS) improving margin by 2% recovers $1.2M annually. A $100K platform cost has clear ROI.
Time Savings Value
Beyond margin improvement, analysis software saves time versus manual Excel analysis.
Typical time investment for monthly margin analysis:
- Excel: 10-20 hours monthly for experienced analysts
- Mid-market platform: 2-5 hours monthly
- Enterprise platform: 0.5-2 hours monthly (mostly automated)
If a pricing analyst earning $80K annually ($40/hour fully loaded) spends 15 hours monthly on Excel analysis (180 hours annually = $7,200), a $30K platform saving 10 hours monthly pays for itself in time alone after factoring in the other business value they can create.
Alternatives to Price Analysis Software
Not every company needs specialized price analysis software.
Excel-Based Analysis
For companies with under 5,000 SKUs, Excel delivers 80% of the value at 1% of the cost.
What works in Excel:
- Margin analysis by product and customer using pivot tables
- Price waterfall charts showing margin erosion
- Discount analysis by customer or product category
- Underpriced product identification using conditional formatting
Limitations:
- Doesn't scale beyond 10,000 transaction rows efficiently
- No automation (must export and refresh manually)
- Prone to formula errors
- Limited statistical capabilities
One-Time Diagnostics
Before committing to ongoing subscriptions, run a one-time diagnostic to quantify your opportunity.
Pryse provides self-serve diagnostics for $1,499. Upload your transaction CSV, receive analysis within 24 hours showing:
- Complete margin analysis by SKU and customer
- Price waterfall visualization
- Top margin leakage sources ranked by dollar opportunity
- Specific quick-win recommendations
Most companies recover 3-10x the diagnostic cost by implementing top recommendations. If opportunities are small, you've saved $20K-$100K by avoiding unnecessary software subscriptions.
Business Intelligence (BI) Tools
If you already have BI tools like Tableau, Power BI, or Looker, consider building price analysis dashboards before buying specialized software.
Pros: Leverage existing software and skills, integrate with other business dashboards, no incremental software costs
Cons: Requires internal BI expertise to build, less pricing-specific features than dedicated tools, ongoing maintenance responsibility
Getting Started with Price Analysis
Most companies should start with diagnostics before committing to subscriptions.
Step 1: Export Transaction Data from Your ERP
Pull 12 months of transaction history with these fields:
- SKU, customer, invoice price, quantity, cost, transaction date
Most ERPs make this export straightforward. Check with your ERP administrator or vendor support for standard export format.
Step 2: Run Initial Analysis
Option A: Excel analysis (free)
Import data into Excel, create pivot tables showing margin by product and customer, identify top underpriced items.
Time investment: 5-20 hours for initial setup.
Option B: Self-serve diagnostic ($1,499)
Upload CSV to Pryse, receive professional analysis within 24 hours.
Time investment: 1-2 hours to prepare export.
Step 3: Quantify Opportunity
Calculate total recoverable margin from top 10-20 issues identified:
- Underpriced products (price too low vs margin target)
- High-volume, low-margin customers (renegotiation targets)
- Excessive discounting (discount discipline problems)
- Cost increases not passed through (update price lists)
If recoverable margin is under $50K, fix problems manually. Don't invest in software yet.
If recoverable margin is $100K-$500K, consider mid-market analysis platforms for systematic workflows.
If recoverable margin is $500K+, evaluate both analysis and optimization platforms.
Step 4: Evaluate Software (Only If Justified)
Once you've confirmed opportunity size and complexity:
For mid-market analysis platforms:
- Request demos from Competera, Vistaar, or Pricefx analytics module
- Ask vendors to analyze a sample of your data during the demo
- Budget 1-2 months for vendor selection
- Plan 1-3 month implementation
For enterprise analytics:
- Request demos from Pricefx, Vendavo, Zilliant, PROS (analytics-only configurations)
- Budget 2-3 months for vendor selection
- Plan 3-6 month implementation for analytics (less than full optimization)
Step 5: Implement and Monitor ROI
Track margin improvement monthly after implementing fixes or deploying software:
- Baseline margin (before analysis)
- Current margin (after implementing changes)
- Margin improvement percentage and dollar amount
- Software cost per month
- Time savings per month
Most companies see positive ROI within 3-6 months from price analysis, whether using Excel, diagnostics, or platforms.
Next Steps
Before evaluating price analysis software vendors, understand your baseline. Most companies discover they have $100K-$1M in recoverable margin they didn't know about.
For companies using Excel today:
Run a margin diagnostic first. This costs $1,499 with Pryse and takes 24 hours from CSV upload to results. You'll learn:
- Your actual margin by product and customer (most companies are surprised)
- Where margin leakage occurs and how much is recoverable
- Whether Excel, analysis platforms, or optimization platforms match your complexity
For companies ready for analysis platforms:
Start with the lowest-cost option that meets your needs. Don't pay for enterprise capabilities until you've exhausted mid-market tools.
Path: Excel → diagnostic → mid-market platform → enterprise analytics → add optimization later
Most companies skip steps and overspend. The best price analysis software is the simplest tool that quantifies your opportunities and fits your budget.
For companies ready to explore pricing optimization strategy beyond analysis software, see our complete pricing optimization guide covering frameworks, organizational design, and when to upgrade from analysis to optimization.
For comparison of full optimization platforms with AI and machine learning capabilities, see our pricing optimization software buyer's guide.
Sources
- Capterra: Best Pricing Optimization Software 2026
- CRO Club: 25 Best Pricing Software Reviewed For 2026
- Gartner Peer Insights: Best B2B Profit Optimization Software Reviews 2026
- G2: Best Pricing Software User Reviews from February 2026
- 6sense: Pricing Optimization Market Analysis
- Prisync: Competitor Price Tracking & Monitoring
- Orb: 10 Best Competitive Pricing Tools to Monitor and Beat Your Rivals
- Orb: The 8 Best Pricing Analytics Software in 2025 to Grow Revenue
- Orb: Pricing Analysis Software - Top Tools for Usage-Based Billing
- Wikipedia: Price Optimization
- SurveyMonkey: Price Analysis And Optimization
- Zilliant: Pricing Software - What It Is and How It Works
- Gitnux: Top 10 Best B2B Pricing Software of 2026
Last updated: February 23, 2026
Frequently Asked Questions

Want to analyze your entire product catalog?
Pryse automatically identifies margin leakage across thousands of SKUs. Upload your data and find hidden profit in 24 hours.
One-time $1,499 diagnostic. No subscription required.