B2B Pricing Analytics: Turn Transaction Data Into Margin Recovery
Pricing analytics transforms raw ERP data into actionable insights. Learn what distributors and manufacturers track, how analytics differ from optimization, and what margin lift to expect.
B2B pricing analytics is the process of collecting, analyzing, and interpreting transaction data to understand how pricing affects profitability, identify margin leakage, and make data-driven pricing decisions for distributors and manufacturers.
Most mid-market distributors and manufacturers operate on 3-8% net margins. According to Zilliant's research, using pricing analytics to optimize pricing decisions represents one of the largest opportunities for companies to drive incremental sales and profits, with companies often achieving 15-20% improvements in price and promotion investments. On a $50M business with 5% net margins, a 3% gross margin improvement from analytics-driven pricing decisions adds $1.5M directly to the bottom line.
The challenge: most companies track list prices in their ERP but have limited visibility into realized margins after discounts, rebates, freight absorption, and payment terms. Pricing analytics closes this gap by transforming raw transaction data into actionable margin insights.
This post explains what B2B pricing analytics actually measures, how it differs from pricing optimization, what metrics distributors and manufacturers track, and when analytics software makes sense versus Excel-based analysis.
What B2B Pricing Analytics Actually Measures
Pricing analytics for distributors and manufacturers focuses on understanding the gap between list prices and realized margins at the transaction level.
The core question pricing analytics answers: Where is margin disappearing between our price list and the cash we actually collect?
Three Categories of Pricing Analytics
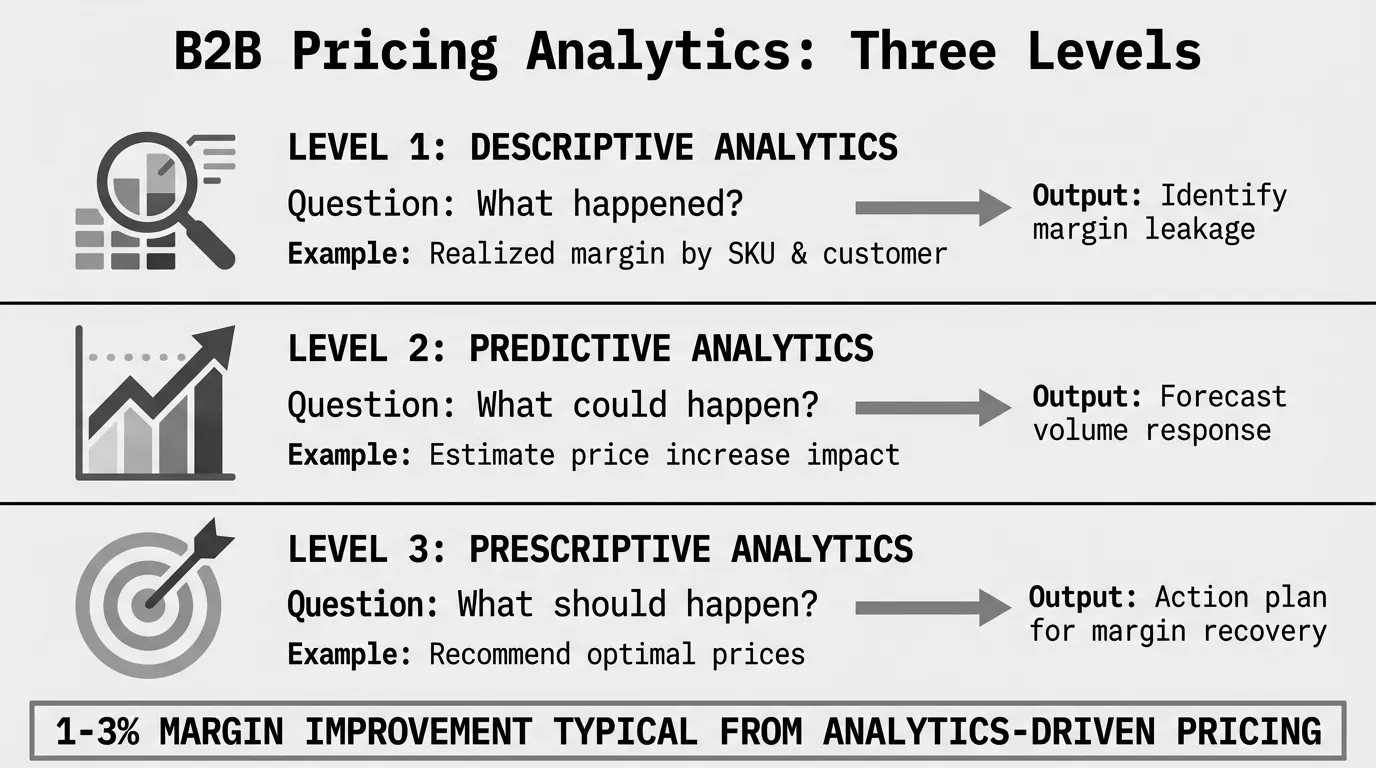
Zilliant's framework categorizes pricing analytics into three types that illuminate what has happened, what could happen, and what should happen.
1. Descriptive Analytics (Backward-Looking)
Descriptive analytics examines historical transaction data to understand what happened and why. For distributors and manufacturers, this means analyzing:
- Realized margin by SKU, customer, product category, and sales rep
- Price waterfall showing list-to-pocket erosion through discounts, rebates, and freight
- Discount variance (approved discounts versus actual discounts given)
- Customer profitability including cost-to-serve
- Price realization rate (invoice price as % of list price)
- Volume-weighted average price trends over time
A $60M electrical distributor might discover through descriptive analytics that their average realized margin is 24%, but ranges from -2% to 47% depending on customer and product mix. The outliers reveal where margin leakage occurs.
2. Predictive Analytics (Forward-Looking)
Predictive analytics uses machine learning to forecast future outcomes based on historical patterns. Applications include:
- Predicting how volume will respond to proposed price increases
- Estimating customer price sensitivity by segment
- Forecasting margin impact of competitor price changes
- Identifying which customers are likely to accept price increases
- Projecting revenue and margin outcomes from pricing scenarios
A manufacturer might use predictive analytics to estimate that raising prices 4% on commodity SKUs will reduce volume 2.5%, resulting in net margin improvement of 1.3%. This prediction guides the pricing decision.
3. Prescriptive Analytics (Decision-Supporting)
Prescriptive analytics recommends specific pricing actions to achieve business objectives like maximizing margin, defending market share, or improving customer profitability.
Distribution Pricing notes that prescriptive pricing analytics goes beyond predictive analytics by not only predicting what could happen but prescribing actions on how to achieve better results, striving to achieve specific outcomes such as increased profits or market share.
Examples include:
- Recommending optimal list price by SKU based on cost, competitor positioning, and elasticity
- Suggesting customer-specific pricing to improve profitability on underpriced accounts
- Identifying which products should be discontinued due to persistent margin problems
- Prescribing discount limits by product category to prevent margin erosion
Most mid-market companies start with descriptive analytics (understand current margins), selectively use predictive analytics (estimate price change impacts), and only implement prescriptive analytics when complexity justifies the investment.
Pricing Analytics vs Pricing Optimization: The Critical Difference
The terms "pricing analytics" and "pricing optimization" are often confused, but they represent different stages of the pricing improvement process.
Pricing analytics is about understanding. It analyzes historical data to answer: What margins are we realizing? Where is margin leaking? Which customers and products are most profitable?
Pricing optimization is about action. It uses analytics insights to determine optimal prices and implement changes that improve margins.
According to DealHub's glossary, the fundamental distinction is that pricing analytics is about understanding and analyzing pricing data, while pricing optimization is about using those insights to actively determine and implement the best prices. Analytics provides the insights; optimization uses those insights to take action.
The Analytics-to-Optimization Workflow
Step 1: Descriptive Analytics (Diagnosis)
- Export 12 months of transaction data from ERP
- Calculate realized margin by SKU and customer
- Identify margin outliers and leakage sources
- Quantify the $ opportunity in fixing top issues
Step 2: Root Cause Analysis (Investigation)
- Why is Customer X buying Product Y at 12% margin when list margin is 28%?
- Are discounts approved or unauthorized?
- Is pricing outdated (cost increased but prices didn't)?
- Is freight being absorbed when it shouldn't be?
Step 3: Predictive Analytics (Impact Estimation)
- If we raise prices 5% on underpriced SKUs, what volume impact do we expect?
- Which customers will accept the increase without defecting?
- What's the net margin improvement after accounting for volume loss?
Step 4: Prescriptive Analytics (Recommendation)
- Recommended price adjustments by SKU and customer
- Prioritized list of pricing actions ranked by $ impact
- Implementation timeline and risk assessment
Step 5: Pricing Optimization (Execution)
- Update price lists in ERP
- Communicate changes to sales and customers
- Monitor volume and margin impact
- Refine approach based on results
Analytics (steps 1-4) tells you what to do. Optimization (step 5) is actually doing it. You can't optimize pricing without analytics, but analytics alone doesn't improve margins—you have to act on the insights.
See our complete guide on pricing optimization for frameworks and best practices on moving from analysis to implementation.
Key Metrics B2B Companies Track
Effective pricing analytics focuses on a core set of metrics that reveal margin performance and leakage sources.
Core Profitability Metrics
Realized Margin by SKU
Realized Margin % = (Pocket Price - COGS) / Pocket Price × 100This shows actual margin after all discounts, rebates, and deductions. Most companies track list margin but don't calculate realized margin consistently.
A distributor might have 32% list margin, 28% invoice margin, and 22% realized pocket margin after rebates and freight. The 10-point gap (32% to 22%) represents margin leakage.
Customer Profitability
Revenue and margin by customer, ideally adjusted for cost-to-serve (picking, packing, shipping, returns, customer service costs).
A $500K/year customer buying at 25% gross margin might be less profitable than a $200K/year customer buying at 30% margin if the larger customer requires high-touch service and frequent expedited shipments.
Price Realization Rate
Price Realization % = Invoice Price / List Price × 100Tracks how much of list price you actually capture. A 75% realization rate means customers are getting 25% off list on average through discounts.
Low realization rates signal discount discipline problems or outdated list prices. Target: 85-95% realization for most B2B distributors.
Margin Leakage Metrics
Price Waterfall Components
The price waterfall visualizes margin erosion from list price to pocket price:
- List price (100%)
-
- Invoice discounts (8%)
-
- Off-invoice rebates (5%)
-
- Freight absorption (3%)
-
- Payment term costs (2%)
-
- Returns and allowances (1%)
- = Pocket price (81%)
Track each waterfall component as % of list price to identify where margin leaks most.
Discount Variance
Compares approved discount levels to actual discounts given. If approved discount is 15% but sales reps consistently give 22%, the 7-point variance represents unauthorized margin leakage.
Discount Variance = Actual Discount % - Approved Discount %Cost-to-Serve by Customer
Total operational costs (picking, packing, shipping, service, credit costs) divided by customer revenue.
A customer generating $300K revenue with $45K cost-to-serve (15% of revenue) reduces net margin significantly compared to the same revenue customer with 5% cost-to-serve.
Pricing Effectiveness Metrics
Volume-Weighted Average Price (VWAP)
VWAP = Σ(Price × Volume) / Σ(Volume)Tracks average realized price weighted by volume sold. Useful for monitoring whether price increases are sticking or being offset by mix shift to lower-priced products.
Win Rate by Price Position
For quote-driven businesses, track win rate by how your quoted price compares to estimated competitor pricing.
If you win 70% of quotes when priced within 3% of competitors but only 20% when priced 10% higher, this reveals your competitive price sensitivity threshold.
Price Elasticity by Product Category
How volume changes in response to price changes. Essential for predicting the volume impact of planned price increases.
A commodity fastener with -1.8 elasticity (highly elastic) requires different pricing strategy than a specialty chemical with -0.3 elasticity (inelastic).
How Distributors and Manufacturers Use Pricing Analytics
Companies apply pricing analytics differently based on business model, SKU count, and pricing complexity.
Distribution Pricing Analytics Use Cases
Identify Underpriced SKU-Customer Combinations
A $45M HVAC distributor analyzed transaction data and discovered 847 SKU-customer combinations priced below cost after discounts and freight. Fixing just the top 50 combinations recovered $280K annually.
Rationalize Customer-Specific Pricing
Many distributors have hundreds of customer-specific price agreements negotiated over years. Analytics reveals which agreements are still profitable and which destroy margin.
According to distribution pricing experts, pricing analytics is important for gaining a competitive advantage in distribution because it helps businesses understand how their pricing strategies affect profitability, demand, customer behavior and market forces.
Optimize Freight Policies
Freight absorption is a major margin leak for distributors. Analytics quantifies freight costs by customer and order size to set minimum order thresholds and freight policies that protect margins.
Rebate Tracking and Compliance
Many distributors participate in vendor rebate programs but don't track earned rebates systematically. Analytics calculates expected rebates by vendor and flags shortfalls.
Manufacturing Pricing Analytics Use Cases
Channel Pricing Consistency
Manufacturers selling through multiple channels (direct, distributors, dealers, e-commerce) use analytics to ensure pricing is consistent across channels and prevent channel conflict.
Price Increase Impact Analysis
Research from Copperberg shows that for manufacturers, dynamic pricing enabled by AI and analytics offers a way to stay ahead of shifting costs, fluctuating demand, and evolving customer expectations. Analytics helps manufacturers model the volume and margin impact of price increases before implementation.
Product Mix Profitability
Manufacturers with broad product lines use analytics to identify which products drive margin and which are margin drags. This informs SKU rationalization decisions.
Cost Pass-Through Tracking
When raw material costs increase, analytics tracks how quickly price increases are implemented and whether margin is being protected during cost volatility.
Excel vs Pricing Analytics Software: When to Upgrade
Most companies start pricing analytics in Excel. The question is when to invest in specialized software.
When Excel Works Fine
Small Catalog, Straightforward Pricing
Companies with under 5,000 active SKUs and relatively simple customer pricing can analyze margins effectively in Excel.
The process:
- Export transaction data from ERP (SKU, customer, date, quantity, price, cost)
- Calculate margin by SKU and customer using pivot tables
- Identify outliers (margins more than 2 standard deviations from mean)
- Investigate root causes manually
- Implement pricing corrections
A $30M distributor with 3,500 SKUs completed this analysis in Excel over 2 weeks and identified $450K in recoverable margin from fixing underpriced accounts.
Limited Transaction Volume
If you process under 1,000 transactions monthly, Excel handles the data volume without performance issues.
One-Time Analysis
For companies conducting pricing reviews quarterly or annually, Excel provides sufficient analysis capability without ongoing software costs.
See our guide on margin analysis in Excel for step-by-step instructions.
When to Invest in Analytics Software
Large SKU Catalogs (10,000+)
At 20,000+ SKUs across hundreds of customers, manual Excel analysis becomes impractical. Software automates data integration, calculation, and outlier identification.
High Transaction Volumes
Processing 5,000+ transactions monthly in Excel leads to slow performance, file corruption, and version control problems. Analytics software handles large datasets efficiently.
Complex Customer Pricing
When every major customer has negotiated pricing with different discount structures, rebate agreements, and payment terms, software systematically tracks profitability by account.
Frequent Price Reviews
Companies updating prices monthly or quarterly benefit from automated analytics dashboards that continuously track margin performance.
Multiple Pricing Dimensions
If you need to analyze margin by SKU × customer × region × sales rep × time period, Excel pivot tables become unwieldy. Analytics software handles multidimensional analysis cleanly.
Benefits of using a pricing analytics dashboard include improved understanding of what prices are most and least effective, ability to quickly spot changes in customer demand and adapt prices as needed, and better understanding of how price changes impact overall sales.
Pricing Analytics Software for Mid-Market Companies
The pricing analytics software market ranges from enterprise platforms to mid-market solutions optimized for distributors and manufacturers.
Mid-Market Analytics Platforms
Revenue Analytics
Revenue Analytics delivers AI-powered pricing software combined with hands-on support for manufacturing and distribution enterprises. The platform generates daily price recommendations for manufacturers based on cost changes, competitor movements, and demand patterns.
Zilliant
Zilliant's approach focuses specifically on B2B manufacturers and distributors, providing analytics for margin optimization, customer segmentation, and price-volume-mix analysis across large SKU catalogs.
Phocas
Phocas Software specializes in distribution analytics with pricing modules that integrate directly with distribution ERPs to track realized margins and identify pricing opportunities.
Intuilize
Intuilize helps distributors optimize prices by analyzing massive datasets to identify pricing patterns, customer behavior, and market trends, enabling data-driven decisions that maximize profitability.
Enterprise Platforms
For large manufacturers and distributors with 50,000+ SKUs and complex global pricing:
Vendavo - Enterprise pricing and analytics platform with price-volume-mix analysis and customer price governance
Pricefx - Cloud-based pricing software with advanced analytics and centralized price management
Vistaar - SaaS provider specializing in pricing, promotion, configuration, and rebate management using predictive models and machine learning
Cost Considerations
Mid-market analytics software typically costs $20K-$100K annually. Implementation adds 0.5-1x the subscription cost ($10K-$50K) for data integration, configuration, and training.
Enterprise platforms cost $100K-$500K annually with implementation costs of 1-3x the subscription ($100K-$1.5M).
For a $50M distributor, investing $40K annually in analytics software that recovers 2% margin ($1M annually) pays back in under 3 weeks.
See our pricing optimization software guide for detailed vendor comparisons.
Getting Started with Pricing Analytics
Most companies should start with basic descriptive analytics before investing in sophisticated predictive or prescriptive capabilities.
Step 1: Data Extraction (Week 1)
Export 12 months of transaction history from your ERP with these fields:
- Transaction date
- SKU identifier and description
- Customer identifier and name
- Invoice price
- Quantity sold
- Cost (COGS)
- Freight charged vs actual freight cost
- Discounts and rebates
If your ERP can't export this data easily, you have bigger problems than pricing analytics. Fix data accessibility first.
Step 2: Basic Margin Analysis (Week 2)
Calculate realized margin by SKU and customer:
Realized Margin = (Invoice Price - All Discounts - Freight Cost - COGS) / (Invoice Price - All Discounts)Create pivot tables showing:
- Margin distribution by SKU (what % of SKUs are below target margin?)
- Margin by customer (which customers are unprofitable?)
- Margin by product category
- Margin trends over time
Step 3: Outlier Identification (Week 3)
Identify margin outliers that warrant investigation:
- SKU-customer combinations with negative or near-zero margins
- Customers buying significantly below list price without justification
- Products with wildly inconsistent margins across customers
- Margin degradation trends (declining margins over 6-12 months)
Rank outliers by $ opportunity: margin gap × annual volume.
Step 4: Root Cause Analysis (Weeks 4-6)
For top 20 outliers, investigate:
- Are discounts approved or unauthorized?
- Has cost increased but pricing not updated?
- Are rebates being calculated and collected?
- Is freight being absorbed inappropriately?
- Are payment terms longer than standard (hidden cost)?
Step 5: Implement Corrections (Ongoing)
Start with low-risk, high-impact opportunities:
- Raise prices on clearly underpriced accounts
- Discontinue SKUs with persistent margin problems
- Tighten discount approval for products below margin thresholds
- Implement freight minimums or surcharges
Track results monthly. Most companies recover 1-3% margin within 6 months of implementing analytics-driven pricing corrections.
Step 6: Automate and Scale
Once you've proven the value through manual analysis, consider analytics software to:
- Automate monthly margin reporting
- Expand analysis to more pricing dimensions
- Add predictive capabilities for price increase planning
- Integrate prescriptive recommendations into pricing workflows
Common Pricing Analytics Mistakes
Companies waste time and money on analytics by:
Analyzing Without Acting
Analytics that don't lead to pricing changes deliver zero margin improvement. The value comes from implementation, not analysis. If organizational resistance prevents pricing changes, fix that before investing in analytics.
Ignoring Data Quality
Analytics built on poor ERP data produces unreliable insights. If your system has duplicate SKUs, missing costs, or inconsistent customer records, clean the data before analyzing it.
Over-Investing in Sophistication
A $20M distributor with 2,000 SKUs doesn't need enterprise AI analytics. Excel delivers 80% of the insight at 1% of the cost. Match analytics complexity to business complexity.
Neglecting Change Management
Pricing analytics often reveals uncomfortable truths: favorite customers are unprofitable, sales reps give unauthorized discounts, pricing hasn't been updated in 3 years. Analytics implementation requires addressing these organizational issues, not just running reports.
Analysis Paralysis
Perfect analytics is the enemy of better pricing. Don't wait for comprehensive predictive models before fixing obvious margin leakage. Start with basic descriptive analytics and implement improvements while building more sophisticated capabilities.
The Future of B2B Pricing Analytics
The pricing analytics landscape in 2026 is shifting from periodic analysis to continuous monitoring.
Emerging Trends
Real-Time Analytics Dashboards
The PricingSaaS 500 Index tracked more than 1,800 pricing changes across the top 500 B2B companies in 2025 alone—3.6 pricing changes per company in a single year. This velocity requires real-time analytics that continuously monitor margin performance.
AI-Powered Pattern Detection
Machine learning models automatically identify margin leakage patterns across thousands of SKU-customer combinations that would take humans months to analyze manually. Only AI technology can reduce the resources needed for the price optimization process because of its ability to consume and metabolize massive databases for forecasting trends in costs and customer behavior.
Integrated Pricing Workflows
Analytics is moving from standalone reporting to embedded recommendations within quoting, pricing, and ERP systems. Sales reps see margin guidance in real-time during customer negotiations rather than discovering pricing problems in quarterly reviews.
Subscription and Usage-Based Pricing Analytics
As B2B business models evolve, pricing in 2026 is increasingly a living system, not a static price book. Subscription, usage-based, and outcome-based models require continuous monitoring of how customers adopt, expand, or churn in response to price levels.
For most mid-market distributors and manufacturers, the immediate opportunity isn't cutting-edge AI analytics—it's basic margin analysis that most companies still haven't done systematically.
Conclusion
B2B pricing analytics transforms raw ERP transaction data into actionable margin insights that drive profitability improvements of 1-3% for distributors and manufacturers.
The analytics journey starts with basic descriptive analysis in Excel (what margins are we realizing?), progresses to predictive analytics (how will customers respond to price changes?), and optionally advances to prescriptive analytics (what prices should we set?).
Most mid-market companies should focus on:
- Calculating realized margin by SKU and customer
- Identifying top margin leakage sources
- Implementing pricing corrections on high-impact opportunities
- Automating analytics once manual analysis proves the value
Analytics software makes sense when SKU catalogs exceed 10,000, transaction volumes are high, or customer-specific pricing complexity makes Excel impractical.
The margin improvement opportunity is immediate. A $50M distributor discovering they're leaving $1.5M on the table through underpricing doesn't need sophisticated AI—they need basic analytics and the organizational discipline to act on what the data reveals.
Start simple. Export transaction data, calculate margins, fix outliers. You'll recover your first $100K-$500K in margin before needing expensive analytics software.
For companies ready to move from analysis to implementation, see our complete guide on pricing optimization covering frameworks, organizational design, and execution best practices.
Sources
- Zilliant: The Power of Pricing Analytics in B2B Industries
- Zilliant: An In-Depth Overview of Pricing Analytics
- DealHub: What is Pricing Analytics?
- Distribution Pricing: What Are Pricing Analytics in Distribution
- Omnibound: B2B Pricing 2026 Guide
- PandaDoc: What Is Pricing Analytics? How Data-Driven Pricing Boosts Profitability
- Phocas Software: How Pricing Strategies Work Better with Data Analytics
- Intuilize: How AI Helps Distributors Optimize Prices for Maximum Return
- Copperberg: Dynamic Pricing in B2B Manufacturing
- Inventory Source: Data-Driven Pricing Strategies Using Analytics
- Revenue Analytics: Pricing As A Service Solutions
- WithOrb: The 8 Best Pricing Analytics Software
Last updated: February 24, 2026
Frequently Asked Questions

Want to analyze your entire product catalog?
Pryse automatically identifies margin leakage across thousands of SKUs. Upload your data and find hidden profit in 24 hours.
One-time $1,499 diagnostic. No subscription required.