Pricing Optimization Models: Complete Guide to Types & Applications
From cost-plus to machine learning models—understand which pricing optimization approach fits your business. Complete breakdown for distributors and manufacturers.
A pricing optimization model is an analytical framework that determines optimal prices by analyzing data like costs, competitor pricing, demand elasticity, and customer behavior to maximize revenue, margin, or market share. Models range from simple cost-plus formulas to complex machine learning algorithms that predict price-volume relationships across thousands of SKU-customer combinations.
For mid-market distribution and manufacturing companies, choosing the right pricing model means balancing sophistication with implementation complexity. A $50M distributor with 5,000 SKUs doesn't need the same model as a Fortune 500 company managing 100,000 SKUs across global markets.
According to research on the S&P 500, a 1% improvement in price realization produces an 11% improvement in operating profit. The right pricing model makes that improvement possible without overspending on unnecessary complexity.
This post explains the major pricing optimization models, when each one makes sense, how to choose based on your business characteristics, and what results to expect.
What Pricing Optimization Models Actually Do
Pricing optimization models convert business inputs (costs, competitor prices, transaction history, market data) into pricing recommendations that maximize your objective—typically margin, revenue, or market share.
All pricing models answer three questions:
- What should we charge? The recommended price point for each SKU or customer segment
- Why that price? The rationale based on costs, value, competition, or demand patterns
- What's the expected outcome? Predicted impact on volume, revenue, and margin
Where models differ:
- Complexity: From simple markup formulas to AI models analyzing millions of transactions
- Data requirements: From just COGS to years of transaction history plus external market data
- Adaptability: Static rules you set manually vs. algorithms that learn from new data
- Implementation cost: Excel spreadsheets vs. $100K+ software platforms
The right model isn't the most sophisticated one—it's the one that delivers margin improvement proportional to implementation cost and matches your data quality, SKU count, and pricing complexity.
Traditional Pricing Models
These foundational models power pricing at most mid-market distribution and manufacturing companies today. They're simple, transparent, and work well until complexity exceeds what humans can manage manually.
Cost-Plus Pricing Model
Cost-plus is the most widely used pricing model in distribution and manufacturing. As Intuilize explains in their distributor pricing guide, manufacturers add their desired profit margin to cost to set preferred price, and distributors carrying these products add business costs (shipping, sales, marketing, facility maintenance) before adding their own profit margin.
How it works:
Price = COGS × (1 + Target Margin %)If a part costs $50 and you target 30% margin, the price is $71.43. If you want $21 profit instead, the price is $71.
When cost-plus makes sense:
- You have under 5,000 SKUs with stable costs
- Margins are straightforward (single markup across categories)
- Competitive positioning is clear (you're not constantly undercutting or being undercut)
- Customer relationships are consultative, not transactional
Limitations:
Cost-plus ignores what customers will pay. You might set 30% margin on Product A when customers would accept 40%, leaving money on the table. Conversely, you might price Product B with 30% margin when competitors sell similar items at 15%, losing volume you could capture.
Most distributors start with cost-plus, then add competitive adjustments manually or build customer-specific pricing on top of the base formula.
Competitive Pricing Model
Competitive pricing uses competitors' prices as the benchmark. According to PriceFX's pricing model guide, this approach sets prices based on market rate of similar products with no consideration for manufacturing or shipping costs.
How it works:
You monitor competitor pricing for comparable products and set your price relative to the competitive set—matching, slightly below, or slightly above depending on positioning strategy.
Common approaches:
- Match lowest competitor: Your price = lowest competitor price
- Position at X% of market: Your price = median competitor price × 0.95
- Premium positioning: Your price = market leader price + 10%
When competitive pricing makes sense:
- You sell commodity or near-commodity products where differentiation is minimal
- Customers actively compare prices and will switch for 5-10% savings
- You have real-time competitor price data (either through market intelligence tools or manual monitoring)
- Volume matters more than margin (you're willing to sacrifice margin for market share)
Limitations:
Competitive pricing can trigger race-to-the-bottom dynamics. If every distributor matches the lowest price, margins erode industry-wide. It also ignores your actual costs—you might price below profitability to match competitors who have better cost structures.
Most companies use competitive pricing selectively on high-visibility SKUs where customers compare prices, while using cost-plus or value-based models elsewhere in the catalog.
Value-Based Pricing Model
Value-based pricing sets prices based on the perceived value to the customer, not your costs or competitor pricing. As defined by market research, value pricing is based on what customers are prepared to pay for the product.
How it works:
You estimate the economic value your product creates for customers—time saved, quality improvement, downtime prevented, throughput increased—and price as a percentage of that value.
Example: A specialized lubricant costs you $25 and generic alternatives cost $30. But your product extends equipment life by 18 months, saving customers $5,000 in replacement costs. You could price at $150 (capturing 3% of customer value) even though cost-plus would suggest $36.
When value-based pricing makes sense:
- Your products deliver measurable customer value beyond commodity alternatives
- Customers understand and can quantify the value difference
- You have differentiation (patents, unique formulations, proven performance data)
- You sell to sophisticated buyers who evaluate total cost of ownership, not just purchase price
Limitations:
Value-based pricing requires customer research to quantify value. Most mid-market companies lack resources to run value research across 10,000+ SKUs. It works for high-value specialty products but doesn't scale to entire catalogs.
Many manufacturers use value-based pricing for differentiated products and cost-plus or competitive models for everything else.
Advanced Optimization Models
When transaction volume and SKU count exceed what traditional models can handle, advanced optimization models use statistical analysis and machine learning to identify pricing opportunities at scale.
Price Elasticity Models
Price elasticity models measure how demand responds to price changes, then recommend prices that optimize revenue or margin based on that sensitivity.
How it works:
The model calculates elasticity for each product (or product-customer combination):
Price Elasticity = (% Change in Quantity Demanded) / (% Change in Price)If a 5% price increase causes a 3% volume decline, elasticity is -0.6 (inelastic). You should raise prices because margin gain exceeds volume loss.
If the same 5% increase causes 8% volume decline, elasticity is -1.6 (elastic). Price increases hurt total revenue.
What the model recommends:
- Inelastic products (elasticity between 0 and -1): Raise prices to maximize margin
- Elastic products (elasticity less than -1): Lower prices to maximize revenue
- Unit elastic (elasticity = -1): Current price is revenue-optimal
According to research on dynamic pricing algorithms, elasticity-based models are the foundation for sophisticated dynamic pricing in retail and distribution.
When elasticity models make sense:
- You have 6-12 months of transaction history with enough repeat purchases to measure price-volume relationships
- Transaction volume exceeds 1,000 monthly (need data density to detect patterns)
- You're willing to test price changes and measure results
- You have products with varying elasticity (some inelastic, some elastic)
Limitations:
Elasticity models need clean data. If your ERP has inconsistent SKU codes, missing transactions, or cost data errors, elasticity calculations will be wrong. They also assume past patterns predict future behavior, which fails during market disruptions.
Most companies use elasticity models for high-volume SKUs with good transaction history, not across entire catalogs.
Regression-Based Optimization Models
Regression models analyze multiple variables simultaneously—cost, competitor price, customer segment, order size, seasonality, inventory levels—to predict optimal prices that maximize your objective.
How it works:
The model builds statistical relationships like:
Optimal Price = f(COGS, Competitor Avg, Customer Segment, Volume Tier, Quarter, Lead Time)The algorithm identifies which factors matter most for each product. Maybe Customer Segment and Volume Tier drive pricing for Product A, while Competitor Avg and Quarter matter for Product B.
Once trained, the model recommends prices based on current conditions. When costs increase 8%, competitor prices rise 5%, and you're in Q4 (historically high-demand), the model might recommend a 10% price increase because historical data shows customers accept it.
When regression models make sense:
- You have 10,000+ SKUs where manual analysis is impossible
- Multiple factors influence optimal pricing (not just cost or competition alone)
- Transaction data is rich with customer, timing, and contextual information
- You want to test "what if" scenarios (what happens if competitor raises prices 10%?)
Limitations:
Regression models require statistical expertise to build and interpret. Most mid-market companies don't have in-house data science teams. They also need significant transaction history—sparse data produces unreliable models.
Typically these models are embedded in mid-market pricing software ($20K-$100K/year) or enterprise platforms ($100K-$500K/year), not built in-house.
Machine Learning Pricing Models
According to 7Learnings' guide comparing pricing tools, machine learning-based dynamic pricing leverages advanced algorithms and artificial intelligence to make real-time pricing decisions by analyzing vast amounts of data, including historical sales, competitor prices, customer behavior, and market trends.
How it works:
ML models learn patterns from data without explicit programming. You feed the system transaction history, competitor data, and business outcomes, and the algorithm discovers relationships like:
- "Industrial customers are inelastic on safety products but elastic on fasteners"
- "Products with 30+ day lead times can price 12% higher without volume loss"
- "Q4 demand lets us price 8% higher on seasonal SKUs"
The model continuously refines predictions as new data arrives. Unlike rule-based or regression models that require manual updating, ML models adapt automatically.
Common ML approaches:
- Neural networks: Pattern recognition across complex, non-linear relationships
- Random forests: Ensemble models that combine multiple decision trees
- Gradient boosting: Iterative optimization that learns from prediction errors
- Reinforcement learning: AI that treats pricing as experimentation, learning from win/loss outcomes
Research on ML pricing evolution shows that pricing solutions have evolved from simple rules-based systems to sophisticated AI models capable of real-time optimization.
When ML models make sense:
- You have 20,000+ SKUs with complex pricing patterns
- Transaction volume exceeds 5,000 monthly with dense, repeat-purchase data
- Customer-specific pricing is too complex to manage with rules (hundreds of negotiated agreements)
- Real-time pricing adjustments deliver clear value (commodity products with volatile costs)
- You've exhausted manual optimization and rule-based models
Limitations:
ML pricing models require:
- Clean, extensive data (12+ months, high transaction density)
- Enterprise software platforms ($100K-$500K annually)
- 6-18 month implementations with dedicated teams
- Ongoing monitoring and model retraining
As 7Learnings explains in their ML pricing analysis, conventional pricing systems cannot learn from new data, since they do not adapt, they react sluggishly and too slowly for today's market.
For most mid-market companies, ML models are overkill until you've recovered margin through simpler approaches first.
Hybrid Pricing Models
Real-world pricing rarely uses one model exclusively. Most companies combine approaches based on product category, customer segment, and strategic objectives.
Cost-Plus with Competitive Floors/Ceilings
The most common hybrid: start with cost-plus, then adjust prices that fall too far from market.
Logic:
- Base price = COGS × (1 + target margin)
- If base price > 110% of market average, reduce to 105% of market
- If base price < 90% of market average, increase to 95% of market (unless cost constraints prevent it)
This preserves profitability while preventing extreme mispricing relative to competition.
Segmented Pricing Models
Use different models for different customer segments:
- Strategic accounts: Value-based or negotiated pricing
- Transactional customers: Competitive or cost-plus pricing
- Low-volume customers: Cost-plus with minimum order surcharges
A $75M distributor might use value-based pricing for top 20 customers (60% of revenue), competitive pricing for mid-tier customers (30% of revenue), and strict cost-plus with fees for small customers (10% of revenue).
Dynamic Rule-Based Systems
According to research on hybrid pricing strategies, the most successful strategy is using the structure of rules as a floor and ceiling while deploying the intelligence of ML to find the peak profit point in the space between.
How it works:
Rules define boundaries:
- Minimum price = COGS × 1.15 (15% margin floor)
- Maximum price = competitor average × 1.10 (10% premium ceiling)
Within those boundaries, optimization algorithms (elasticity-based or ML) recommend the price that maximizes margin while staying competitive.
This approach combines control (rules prevent pricing disasters) with optimization (algorithms find the best price within acceptable bounds).
How to Choose the Right Pricing Model
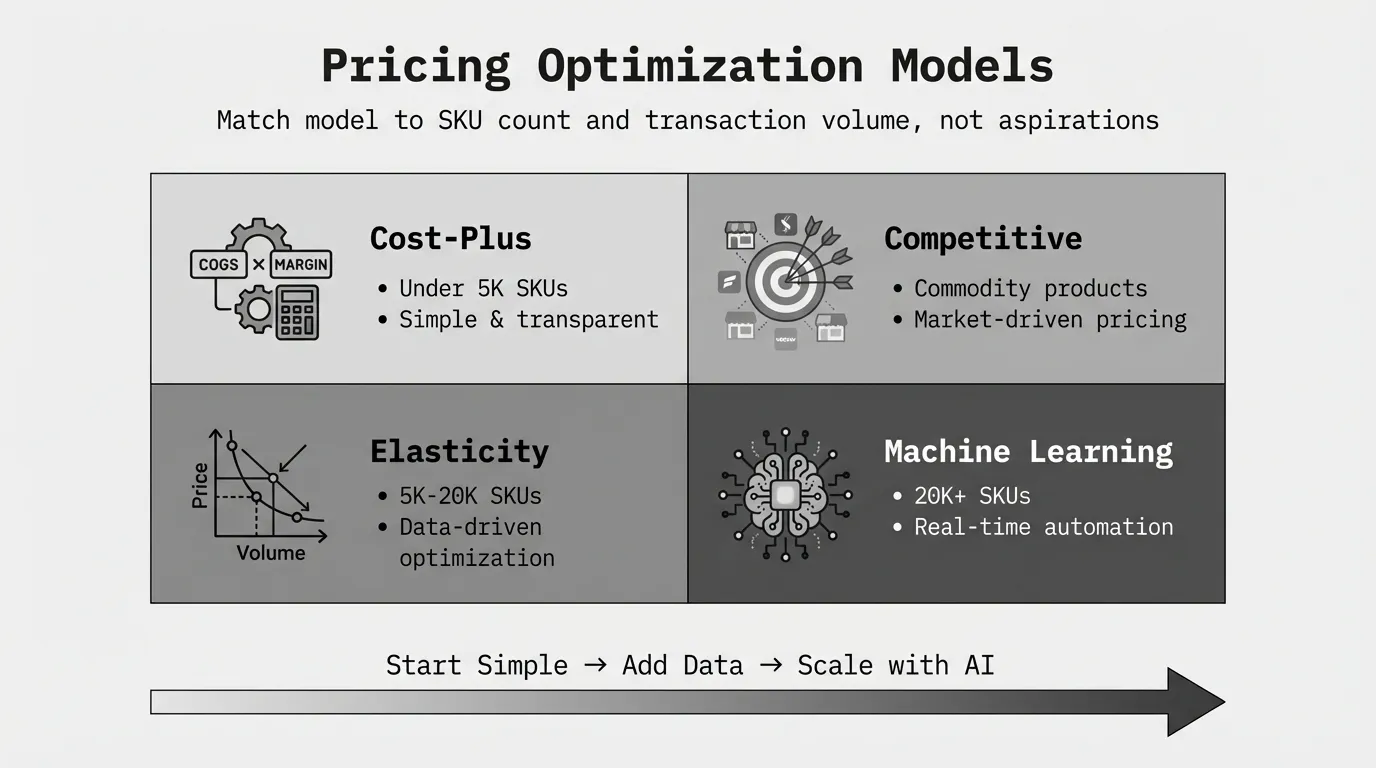
Match your model to your business characteristics, not your aspirations for sophistication.
Decision Framework by SKU Count
Under 1,000 SKUs: Use cost-plus pricing with manual competitive adjustments. Excel analysis identifies underpriced products in 2-3 hours. No software needed.
1,000-5,000 SKUs: Cost-plus as base, with competitive benchmarking on top-100 SKUs by revenue. Add customer-specific pricing for strategic accounts. Excel or basic pricing software ($5K-$20K annually).
5,000-20,000 SKUs: Segmented pricing model: cost-plus for tail SKUs, competitive for high-volume commodity products, value-based for differentiated items. Mid-market pricing software ($20K-$100K annually) with rule-based optimization.
20,000+ SKUs: Regression or ML models required. Human analysis can't scale. Enterprise pricing platforms ($100K-$500K annually) with elasticity analysis and automated optimization.
Decision Framework by Data Quality
Poor data quality (missing costs, inconsistent SKU codes, gaps in transaction history): Stick with cost-plus or competitive models that don't rely on historical analysis. Fix data quality before investing in advanced models.
Moderate data quality (6-12 months clean data, occasional gaps): Use rule-based or basic elasticity models on high-volume SKUs with reliable data. Continue cost-plus for tail SKUs with sparse transaction history.
High data quality (12+ months clean data, rich customer/transaction detail): Advanced regression or ML models become viable. Invest in optimization software that leverages your data quality.
Decision Framework by Transaction Volume
Under 500 transactions/month: Advanced models won't have enough data to detect patterns. Use traditional models (cost-plus, competitive, value-based).
500-2,000 transactions/month: Elasticity models work for high-volume SKUs. Use rule-based optimization for others.
2,000-10,000 transactions/month: Regression models viable. Consider mid-market pricing software with statistical optimization.
10,000+ transactions/month: ML models deliver clear ROI. Enterprise platforms make sense if SKU count and complexity also justify the cost.
Decision Framework by Pricing Frequency
Annual or semi-annual price lists: Static models work fine. Cost-plus with competitive checks, updated twice yearly, handles most distribution/manufacturing scenarios.
Quarterly updates: Rule-based or basic elasticity models. No need for real-time ML if prices change every 90 days.
Weekly or daily changes: Dynamic models required. Commodity distributors with volatile supplier costs need automated optimization—ML models or dynamic rule-based systems.
Real-time pricing: ML models only. Human review can't keep pace. Common in chemical distribution, metals, certain industrial commodities.
Implementing Pricing Optimization Models
Choosing the model is step one. Implementation determines whether you actually recover margin.
Step 1: Baseline Analysis
Before implementing any model, understand your current state:
- What's your average margin by product category?
- Which customers are most profitable?
- How much price variation exists across similar products?
- Where is margin leakage occurring?
Our pricing optimization guide covers baseline analysis in detail. Most companies discover 1-3% margin leakage they didn't know existed just by analyzing what they're already doing.
Step 2: Model Selection and Testing
Pick a model based on the decision frameworks above. Then test it on a low-risk segment:
- 100-500 SKUs with good transaction history
- Non-strategic customers where mistakes won't damage relationships
- Products with elasticity you can measure (enough volume to detect price-volume patterns)
Run the model, implement recommended price changes, and measure results over 60-90 days. Did volume change as predicted? Did margin improve? Did customers defect?
If results match predictions, expand. If not, refine the model or try a different approach.
Step 3: Build Supporting Processes
Pricing models fail without organizational support:
Sales enablement:
- Explanation of why prices changed
- Authority to negotiate within defined ranges
- Customer talking points for price increase conversations
Change management:
- Communication plan for customers
- Gradual rollout (3-5% adjustments, not 20% overnight shocks)
- Feedback loops from sales to pricing team
Data quality:
- Regular audits of ERP data accuracy
- Process for fixing errors and gaps
- Ownership for data maintenance
Performance tracking:
- KPIs: margin by product/customer, price realization, volume trends
- Monthly reviews comparing predicted vs. actual results
- Process for model refinement based on performance
Companies that treat pricing models as technology projects fail. Companies that treat them as business processes with technology enablement succeed.
Model Performance: What Results to Expect
Margin improvement varies by model sophistication and implementation quality.
| Model Type | Typical Margin Lift | Implementation Cost | Timeline |
|---|---|---|---|
| Cost-plus (Excel) | 0.5-1.5% | $0 (internal time) | 1-2 weeks |
| Competitive (manual) | 0.5-1% | $0-$5K (price monitoring) | 2-4 weeks |
| Value-based (strategic SKUs) | 2-4% on affected products | $10K-$50K (customer research) | 2-3 months |
| Rule-based optimization | 1-2% | $20K-$100K annually | 1-3 months |
| Elasticity models | 1-3% | $20K-$100K annually | 2-4 months |
| ML models | 2-5% | $100K-$500K annually + implementation | 6-18 months |
Reality check: These ranges assume:
- Clean data and accurate cost information
- Sales team alignment and customer communication
- Gradual implementation, not overnight price shocks
- Markets where you have pricing power (not commoditized race-to-bottom)
According to research on pricing optimization impact, AI-powered dynamic pricing can increase revenue 10-25% without volume changes. But most of that gain comes from better execution, not just model sophistication.
A $50M distributor recovering 2% margin through basic rule-based optimization generates $1M in additional gross profit. That typically beats the ROI of a complex ML model costing $250K to implement.
Common Mistakes with Pricing Models
Choosing models based on what competitors use
Just because your competitor uses AI pricing doesn't mean you need it. Match the model to your business, not industry trends.
Implementing models before fixing data quality
Garbage data produces garbage recommendations regardless of model sophistication. Clean your ERP data first.
Expecting models to fix strategy problems
If you don't know whether you're competing on cost leadership or differentiation, no model will help. Fix strategy before optimizing tactics.
Moving too fast
A 15% overnight price increase might be optimal mathematically but commercially disastrous. Implement gradually with customer communication.
Ignoring sales team feedback
Your salespeople understand customer relationships and competitive dynamics the model can't see. Combine data-driven recommendations with human judgment.
Neglecting ongoing monitoring
Models degrade over time as markets evolve. Plan for quarterly reviews and annual retraining with updated data.
Getting Started
Most mid-market distributors and manufacturers should start simple before adding complexity.
If you haven't done systematic margin analysis: Export 12 months of transaction data from your ERP. Calculate realized margin by SKU and customer. Identify products priced below target margin and customers buying at excessive discounts. Fix those problems first—typically recovers 1-2% margin in 60-90 days without software.
If you've fixed obvious margin leakage and need scale: Implement rule-based pricing models using mid-market software ($20K-$100K annually). Define margin floors by product category, competitive positioning rules, and customer-specific pricing logic. This handles 5,000-20,000 SKUs systematically.
If you've maxed out rule-based approaches: Evaluate ML models through enterprise platforms. Budget $100K-$500K annually plus 6-18 months implementation. Only makes sense for 20,000+ SKUs, high transaction volume, and proven margin improvement from simpler models.
Next Steps
Before investing in pricing optimization models, run a diagnostic to understand where margin leakage occurs and quantify the opportunity.
Pryse provides self-serve margin diagnostics for $1,499. Upload your transaction CSV, receive analysis within 24 hours showing:
- Price waterfall visualization
- Margin by product and customer
- Top leakage sources ranked by $ opportunity
- Quick-win pricing adjustments
Once you've quantified the opportunity, you'll know which model fits your complexity level and whether software investment makes sense.
For comprehensive coverage of pricing optimization strategy beyond model selection, see our complete pricing optimization guide.
Sources
- Pricing Strategy Optimization: Revenue Guide 2026 - Digital Applied
- 3 Pricing Models Distributors Can Use for Price Optimization - Intuilize
- Price Optimization Models & Techniques: An Introduction - PriceFX
- Product Price Optimizations: How to Handle Them - Qualtrics
- Dynamic Pricing Algorithms in 2026: Top 3 Models - AIM Multiple
- 11 Pricing Tools Compared: AI vs Rule Based - 7Learnings
- Pricing Solutions Evolve: From Rules to AI/ML - Competera
- Machine Learning vs. Traditional Pricing Strategies - 7Learnings
- Dynamic Pricing Models: Rule-Based vs AI Pricing Systems - 42Signals
Last updated: February 23, 2026
Frequently Asked Questions

Want to analyze your entire product catalog?
Pryse automatically identifies margin leakage across thousands of SKUs. Upload your data and find hidden profit in 24 hours.
One-time $1,499 diagnostic. No subscription required.