Pricing Analytics Software: Complete Buyer's Guide for 2026
Compare pricing analytics platforms for B2B companies. Learn what pricing analytics software does, how it differs from optimization, and when distribution and manufacturing companies need it.
Pricing analytics software collects, aggregates, and analyzes pricing data from various sources to identify revenue optimization opportunities, understand customer response to different pricing strategies, and provide actionable insights into market dynamics through dashboards, reports, and visualizations.
According to DealHub's analysis of pricing analytics, pricing analytics involves collecting, aggregating, and analyzing pricing data to identify opportunities for revenue optimization, understand demand for products and services, visualize how customers respond to different pricing strategies, and anticipate competitors' moves.
For mid-market distribution and manufacturing companies, pricing analytics answers questions Excel can't handle at scale: Which customers are most price-sensitive? Which products are underpriced relative to value? Where does margin leak across the price waterfall? Which discounts actually drive volume?
This post explains what pricing analytics software does, how it differs from pricing optimization, when B2B companies need dedicated analytics platforms, and compares leading tools by features and cost.
What Pricing Analytics Software Actually Does
Pricing analytics platforms sit on top of your transaction data and turn raw pricing information into insights that guide pricing strategy and execution.
Core capabilities across all platforms:
- Historical analysis: Shows past pricing performance by product, customer, region, and time period to reveal patterns and trends
- Margin analysis: Breaks down margin by transaction, showing invoice margin, pocket margin, and margin leakage sources
- Price waterfall visualization: Displays list-to-pocket price erosion through discounts, rebates, freight, and terms
- Segmentation analysis: Groups customers or products by price sensitivity, profitability, or behavior patterns
- Dashboards and reporting: Presents pricing KPIs in visual formats for quick decision-making
What differentiates platforms:
- Predictive capabilities: Enterprise tools forecast demand response to price changes using statistical models. Basic tools only report historical data.
- Real-time vs. batch: Advanced platforms analyze data continuously. Mid-market tools update daily or weekly from scheduled data exports.
- Integration depth: Enterprise platforms integrate live with ERPs and data warehouses. Basic tools require CSV uploads.
- Self-service vs. analyst-required: Modern platforms enable business users to build custom reports. Legacy tools require technical analysts to extract insights.
The key distinction: pricing analytics tells you what happened and why (diagnostic), while pricing optimization tells you what to do next (prescriptive). Most companies need both, but analytics comes first to understand baseline performance before optimizing.
Pricing Analytics vs. Pricing Optimization Software
These terms are used interchangeably in marketing but represent distinct capabilities.
| Aspect | Pricing Analytics | Pricing Optimization |
|---|---|---|
| Primary function | Measure and diagnose pricing performance | Calculate and recommend optimal prices |
| Data focus | Historical transaction analysis | Predictive modeling and scenarios |
| Key output | Reports, dashboards, insights | Price recommendations and adjustments |
| Core capability | "What happened and why?" | "What should we do?" |
| Decision support | Understand pricing performance | Execute pricing changes |
| Typical use | Quarterly business reviews, margin analysis | Daily price list updates, quote approvals |
According to Orb's analysis of pricing analytics platforms, a crucial difference is in their output: pricing analytics software provides descriptive and diagnostic insights (what happened and why), while prescriptive pricing optimization software involves advanced algorithms that identify optimal pricing plans and provide instant feedback on how price changes would affect future performance.
In practice:
-
Pricing analytics reveals that Product Line A has 18% pocket margin vs. 23% invoice margin due to freight absorption and payment term costs averaging 5 points. Customer Segment B gets 12% deeper discounts than Segment C but generates 30% lower order values.
-
Pricing optimization recommends increasing Product Line A prices by 3% for customers with freight absorption, tightening discount approval thresholds for Customer Segment B, and repricing 47 specific SKUs showing elasticity patterns that support 2-5% increases.
The platforms are converging. Pure analytics tools are adding recommendation features. Optimization platforms include comprehensive analytics. When evaluating vendors, focus on which capability you need first.
Types of Pricing Analytics
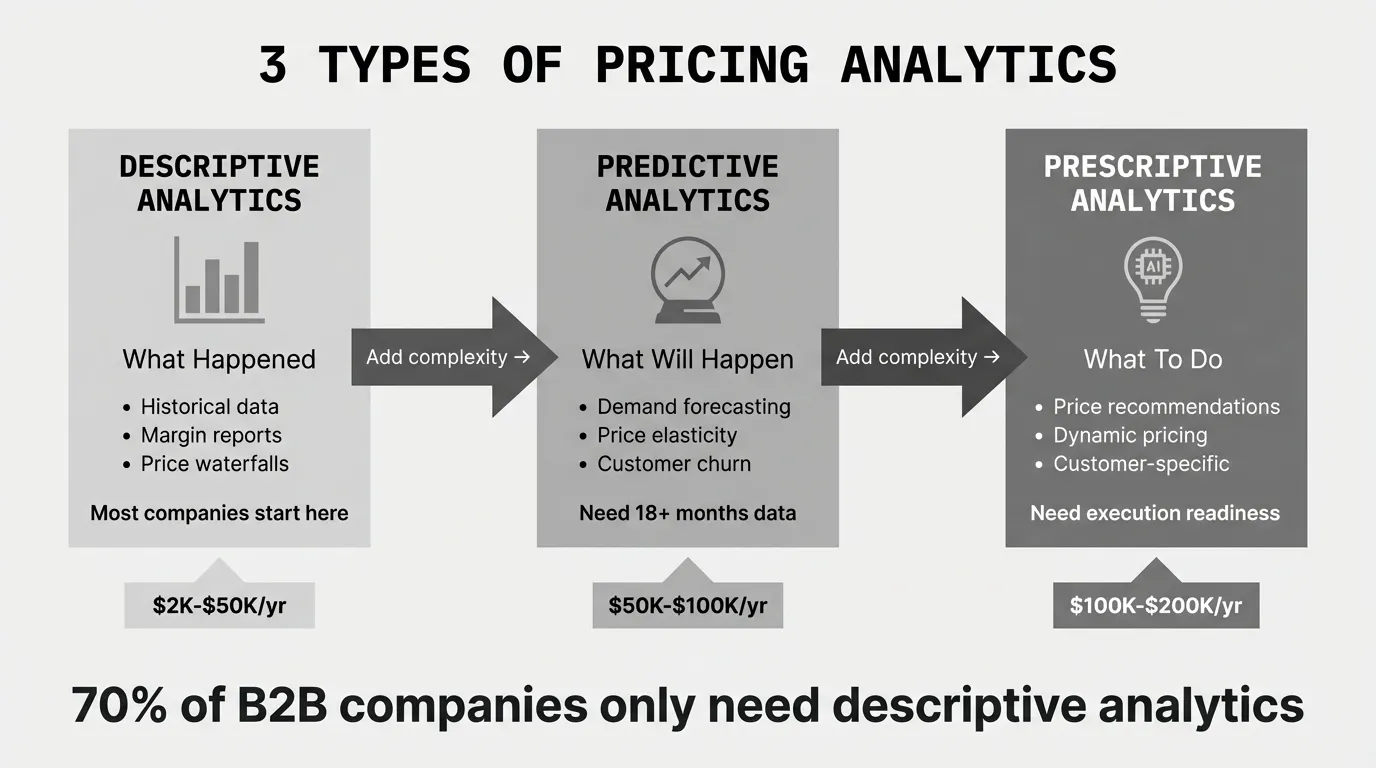
Pricing analytics typically fall into three categories, each building on the previous level.
Descriptive Analytics (What Happened)
What it does: Analyzes historical data to show how past pricing decisions impacted business performance.
Common reports:
- Revenue and margin by product, customer, region, and time period
- Discount pattern analysis showing frequency, depth, and approval rates
- Price waterfall visualization displaying list-to-pocket erosion
- Win/loss analysis by price point and competitor
- Customer price compliance tracking
When it's sufficient: Most distributors and manufacturers start here. If you're using Excel today and haven't systematically analyzed pricing data, descriptive analytics reveals 80% of margin improvement opportunities.
According to Zilliant's overview of pricing analytics, descriptive analytics are backward-looking, analyzing historical data to show how past pricing decisions have impacted business performance. A price waterfall is a step-by-step visual depiction of how much money a company retains from each transaction, making it easy to discern and drill deeper into each cost factor throughout the value chain to uncover areas of margin leakage.
Predictive Analytics (What Will Happen)
What it does: Uses statistical models and machine learning to forecast future outcomes based on historical patterns.
Common capabilities:
- Demand forecasting showing volume response to price changes
- Price elasticity modeling by product and customer segment
- Customer churn prediction based on price increases
- Competitive response modeling
- Market share scenarios under different pricing strategies
When you need it: Companies with 10,000+ SKUs, high transaction volume, and pricing velocity benefit from predictive analytics. By analyzing past trends and market movements, predictive analytics can anticipate future demand fluctuations and adjust pricing strategies preemptively.
Requirements: Predictive analytics requires 18-24 months of clean transaction data with sufficient volume per SKU to measure elasticity statistically. Products with 10-20 transactions annually don't have enough data for meaningful predictions.
Prescriptive Analytics (What Should We Do)
What it does: Recommends specific actions to achieve pricing objectives using algorithms that optimize for revenue, margin, or market share.
Common recommendations:
- Optimal price by SKU and customer based on elasticity and competitive position
- Dynamic pricing adjustments in response to market conditions
- Customer-specific pricing recommendations based on profitability and behavior
- Product bundle pricing to maximize margin and volume
- Discount approval thresholds that balance win rates and profitability
When you need it: Prescriptive analytics delivers ROI when you have organizational readiness to act on recommendations quickly. If your pricing change process takes 3 months from analysis to execution, prescriptive analytics is premature.
According to research on AI pricing tools, while the early 2020s focused on automating manual tasks, 2026 platforms emphasize predictive AI, with companies moving away from rigid rule-based systems that merely react to competitors toward goal-driven platforms that predict demand and optimize for net profit.
When B2B Companies Need Pricing Analytics Software
Not every company requires specialized analytics platforms. Here's when dedicated software delivers clear ROI versus Excel analysis.
Clear Yes: Need Dedicated Software
High complexity (5,000+ SKUs, 500+ customers, customer-specific pricing)
A distributor with 15,000 SKUs, 800 active customers, and customer-specific pricing across product categories can't analyze margin leakage patterns manually. Excel breaks at this scale. Analytics software identifies which customers get excessive discounts, which product categories are systematically underpriced, and where freight absorption erodes margins.
Frequent pricing decisions (weekly price updates, daily quotes)
Companies that reprice weekly or generate hundreds of custom quotes monthly need real-time analytics showing margin impact. Static monthly Excel reports lag too far behind decision-making.
Multi-tier pricing (list, volume, contract, negotiated)
B2B companies using list prices, volume breaks, contract pricing, and one-off negotiations accumulate pricing complexity that analytics software untangles. Which customers actually get volume pricing? Do contract terms improve profitability? Are negotiated deals systematically below target margins?
Distributed pricing authority (regional managers, sales reps approve discounts)
When 10+ people make pricing decisions, analytics software ensures consistency and tracks discount patterns by decision-maker. It reveals which managers approve deeper discounts, whether those discounts drive volume, and where oversight gaps exist.
Probably Yes: Software Helps But Not Urgent
Moderate complexity (1,000-5,000 SKUs, 100-500 customers)
Companies in this range outgrow Excel but can delay software investment if pricing problems are manageable. Start with Excel analysis to quantify opportunities. Invest in analytics software when Excel limitations block improvement.
Quarterly pricing reviews with cost-plus methodology
If you update prices quarterly based on cost changes and standard markups, analytics software provides value but isn't urgent. Excel can handle quarterly analysis. Software delivers ROI when you're ready to move beyond cost-plus to value-based or competitive pricing requiring more sophisticated analysis.
Growing transaction volume (500+ monthly transactions, accelerating)
As transaction volume grows, manual analysis becomes unsustainable. Analytics software future-proofs pricing operations. Consider investment when Excel analysis starts requiring 20+ hours monthly.
Probably No: Excel Sufficient for Now
Low complexity (under 1,000 SKUs, under 100 customers, simple pricing)
A specialty manufacturer with 200 SKUs, 40 customers, and straightforward cost-plus pricing can analyze pricing effectively in Excel. Software overhead exceeds value until complexity increases.
Annual price list updates with stable costs
Companies updating prices once or twice annually based on supplier cost changes don't need real-time analytics. Excel-based annual reviews suffice until market dynamics require more frequent adjustments.
Consultative sales where price isn't primary driver
When customers choose based on technical capability, service, or relationships rather than price, sophisticated pricing analytics delivers minimal value. Focus on improving value delivery, not pricing mechanics.
Poor data quality or incomplete transaction records
Analytics software can't fix bad data. If your ERP has inconsistent SKU codes, missing customer records, or unreliable cost data, clean the data first in Excel before investing in analytics platforms.
Pricing Analytics Software Categories
The market splits into three tiers based on target customer size, complexity, and implementation model.
Enterprise Analytics Platforms ($50K-$200K annually)
Best for: $100M+ revenue companies, 10,000+ SKUs, complex multi-tier pricing, dedicated pricing teams
Leading vendors: PROS, Vendavo, Pricefx, Zilliant (analytics modules within broader pricing suites)
What you get:
- Advanced analytics combining descriptive, predictive, and prescriptive capabilities
- Real-time data integration with ERPs, CRM, and data warehouses via APIs
- Machine learning models for elasticity, customer segmentation, and demand forecasting
- Self-service reporting with drag-and-drop dashboard builders
- Scenario modeling showing revenue and margin impact of pricing changes
- Dedicated implementation teams and ongoing support
What it costs:
Analytics modules within enterprise pricing suites cost $50K-$200K annually depending on SKU count, user count, and features. These platforms bundle analytics with optimization, CPQ, or deal management—rarely sold as standalone analytics.
Implementation timeline: 3-6 months for data integration, model configuration, and user training.
According to Gitnux's 2026 ranking of pricing analytics software, PROS offers an AI-powered pricing and revenue optimization platform that enables dynamic pricing decisions across industries, with enterprise subscription pricing typically starting at $50,000+ annually based on users, modules, and implementation complexity.
When it makes sense:
You have a dedicated pricing team (2+ FTEs), complex pricing requiring daily optimization across 10,000+ SKUs, and can justify $50K-$200K annually from 1-3% margin improvement on $100M+ revenue.
Mid-Market Analytics Tools ($10K-$50K annually)
Best for: $20M-$100M revenue companies, 1,000-10,000 SKUs, quarterly or monthly pricing reviews
Examples: Power BI with pricing dashboards, Tableau with custom analytics, specialized B2B analytics platforms
What you get:
- Pre-built pricing dashboards showing margin, discount patterns, and customer profitability
- Scheduled CSV data imports from ERPs for daily or weekly updates
- Standard reports covering margin waterfalls, pricing variance, and segmentation
- Limited predictive capabilities through built-in statistical functions
- Email support with some implementation guidance
What it costs:
Mid-market pricing analytics solutions range from $10K to $50K annually. Many companies build custom pricing dashboards in Power BI ($10-$20/user/month) or Tableau ($70/user/month) plus 40-80 hours of consultant time for setup ($10K-$20K).
Implementation timeline: 1-2 months for data pipeline setup and dashboard configuration.
When it makes sense:
You've outgrown Excel, need systematic pricing analysis monthly or quarterly, have clean ERP data exports, and can justify $10K-$50K annually for 0.5-1.5% margin improvement.
Basic Reporting Tools ($2K-$10K annually)
Best for: Small distributors and manufacturers needing basic margin visibility
Examples: QuickBooks Advanced Reporting, NetSuite SuiteAnalytics, ERP-native reporting
What you get:
- Standard margin reports by product, customer, and time period from ERP data
- Basic price waterfall showing invoice-to-pocket erosion
- Discount summary reports showing frequency and average depth
- Manual CSV export for external analysis in Excel
- Limited or no predictive capabilities
What it costs:
ERP-native reporting typically costs $2K-$10K annually depending on platform. QuickBooks Advanced Reporting is $200/month. NetSuite SuiteAnalytics is included with certain license tiers or available as add-on.
Implementation timeline: 1-2 weeks for report configuration.
When it makes sense:
You need better pricing visibility than Excel provides but can't justify dedicated analytics software. Your ERP already has transaction data—basic reporting extracts insights without new platforms.
Key Features Comparison
Not all pricing analytics platforms include these capabilities. Here's what to expect at each tier:
| Feature | Enterprise | Mid-Market | Basic |
|---|---|---|---|
| Price waterfall analysis | ✓ (multi-level) | ✓ (basic) | ✓ (invoice only) |
| Customer profitability | ✓ (landed cost) | ✓ (basic margin) | ✓ (invoice margin) |
| Discount pattern analysis | ✓ (AI-driven) | ✓ (rule-based) | ✓ (summary only) |
| Price elasticity modeling | ✓ | Limited | × |
| Demand forecasting | ✓ | Limited | × |
| Customer segmentation | ✓ (ML-based) | ✓ (rule-based) | × |
| Competitive benchmarking | ✓ | ✓ | × |
| Scenario modeling | ✓ | Limited | × |
| Real-time data sync | ✓ (API) | × (CSV batch) | × (CSV batch) |
| Self-service reporting | ✓ | ✓ | Limited |
| Predictive analytics | ✓ | Limited | × |
| Prescriptive recommendations | ✓ | × | × |
How to Choose Pricing Analytics Software
Start by understanding your pricing maturity and organizational readiness, not aspirations.
Decision Framework
Choose enterprise platforms if:
- You have 10,000+ SKUs with complex customer-specific pricing
- Your business processes 5,000+ monthly transactions with repeat customers
- You have a dedicated pricing team (2+ FTEs) ready to use advanced analytics
- You can justify $50K-$200K annually from 1-3% margin improvement on $100M+ revenue
- Implementation capacity exists for 3-6 month projects
- You need predictive and prescriptive capabilities, not just historical reporting
Choose mid-market tools if:
- You have 1,000-10,000 SKUs with moderate pricing complexity
- You update prices monthly or quarterly based on analysis, not daily
- You've outgrown Excel and need systematic pricing visibility
- Budget allows $10K-$50K annually for 0.5-1.5% margin improvement
- You can allocate 1-2 months for implementation
- Historical and diagnostic analytics meet your needs for now
Choose basic reporting if:
- You have under 1,000 SKUs with relatively simple pricing
- Your ERP already contains transaction data needed for analysis
- Budget constraints limit options to under $10K annually
- You need better visibility than Excel but not sophisticated analytics
- Quarterly or monthly reporting meets decision-making cadence
Stick with Excel if:
- You have under 500 SKUs and pricing is straightforward
- Transaction volume is low (under 200 monthly transactions)
- Pricing changes happen annually or semi-annually
- Current Excel analysis takes under 10 hours monthly
- Data quality issues need resolution before investing in software
- Organizational readiness for data-driven pricing doesn't exist yet
According to research on choosing pricing software, the current market is defined by predictive AI, with companies moving away from rigid rule-based systems that merely react to competitors toward goal-driven platforms that can predict demand and optimize for net profit, revenue, or sales precision.
Pricing Analytics for Distribution and Manufacturing
B2B pricing analytics has different requirements than B2C retail due to pricing complexity and relationship-driven sales.
Distribution-Specific Analytics
Customer margin analysis
Distributors need landed cost analysis showing true customer profitability after freight, handling, and payment terms. Basic invoice margin reporting misses 30-40% of cost-to-serve.
Enterprise platforms calculate pocket margin by customer, revealing which relationships are profitable after all costs. A $50M distributor might discover their largest customer (15% of revenue) generates only 8% margin after freight and rebates while a mid-sized customer (5% of revenue) delivers 22% margin.
Rebate tracking and accrual
Distribution pricing includes supplier rebates, volume bonuses, and co-op funds that impact net cost. Analytics software tracks rebate accrual and realization, preventing margin erosion when expected rebates don't materialize.
Product mix shift analysis
Distributors need to understand whether margin changes come from price realization or product mix shift. Analytics platforms decompose margin variance into price, volume, mix, and cost components.
According to Zilliant's analysis of pricing analytics in B2B, for many wholesale distributors, a 1% improvement in average realized price translates directly into a healthy 8-11% lift in operating profit, making pricing analytics one of the highest-ROI investments in B2B distribution.
Manufacturing-Specific Analytics
Quote-to-order analysis
Manufacturers need win/loss analysis showing how quoted prices correlate with order conversion. Analytics platforms track which price levels win business and which lose to competitors.
Contract pricing performance
Manufacturers using annual contracts need analytics showing whether negotiated prices hold throughout contract periods. Many discover sales teams grant one-off exceptions that erode contract profitability.
Channel pricing analysis
Manufacturers selling through distributors, dealers, and direct need channel-level analytics showing margin by route to market. Analytics reveals which channels deliver profitability and which require pricing adjustments.
Custom configuration pricing
Manufacturers offering configured or engineered products need analytics showing profitability by configuration options. Which features drive margin? Which combinations lose money?
Research on overcoming B2B pricing complexity shows that AI and advanced analytics help manufacturers adjust prices on a granular level to reflect each customer's unique needs and value perception, moving beyond blanket pricing tiers.
Implementation Considerations
Pricing analytics software success depends on implementation approach and data quality, not just vendor selection.
Data Requirements
All platforms require clean historical transaction data. Minimum dataset:
- 12-24 months of transaction history (more is better for predictive analytics)
- SKU identifier, description, and product category
- Customer identifier, name, and segment
- Invoice price and quantity
- Cost (COGS or standard cost)
- Transaction date and order number
Additional data for advanced analytics:
- Quoted prices and win/loss outcomes
- Competitive pricing data or market benchmarks
- Customer attributes (size, industry, credit terms)
- Product attributes (category, brand, supplier)
- Freight costs and payment terms
Most companies discover data quality issues during implementation. Budget 30-50% of implementation time for data cleaning, validation, and normalization. Garbage in, garbage out applies especially to pricing analytics.
Organizational Readiness
Critical success factors:
- Executive sponsorship: Leadership commits to acting on pricing insights, not just analyzing them
- Pricing authority: Clear decision rights exist for implementing recommended price changes
- Cross-functional alignment: Sales, finance, and operations agree on pricing objectives and constraints
- Change management: Plans exist for communicating price changes based on analytics findings
- User adoption: Team members will actually use analytics platforms instead of reverting to Excel
Companies that treat pricing analytics as a reporting project fail. Companies that treat it as a business transformation enabling better decisions succeed.
Integration Architecture
Enterprise platforms integrate via APIs with ERP systems, pulling transaction data continuously and syncing with data warehouses. This requires IT resources for API configuration, data mapping, and ongoing maintenance.
Mid-market tools typically use scheduled CSV exports from ERPs, loading data daily or weekly into analytics databases. Less integration complexity but more manual data pipeline management.
Basic reporting runs directly on ERP data without separate platforms. Simplest architecture but limited to ERP-native capabilities.
Alternatives to Pricing Analytics Software
Not every company needs specialized analytics platforms. Several alternatives deliver pricing insights without software subscriptions.
Excel-Based Analysis
For companies with under 1,000 SKUs and straightforward pricing, Excel delivers 70% of the insight at 5% of the cost.
What works in Excel:
- Margin analysis by product, customer, and category using pivot tables
- Price waterfall visualization showing list-to-pocket erosion
- Discount pattern analysis with average depth and frequency
- Customer profitability ranking
- Underpriced product identification using margin thresholds
What doesn't scale in Excel:
- 10,000+ SKU analysis requiring frequent updates
- Statistical price elasticity calculations needing regression analysis
- Predictive demand forecasting
- Real-time dashboard updates
- Customer segmentation using clustering algorithms
See our guide on margin analysis in Excel for step-by-step instructions on building pricing analytics without software.
Power BI or Tableau Custom Dashboards
Many mid-market companies build custom pricing dashboards in Power BI ($10-$20/user/month) or Tableau ($70/user/month) instead of buying dedicated pricing analytics platforms.
Advantages:
- Lower cost than pricing-specific platforms
- Flexibility to build exactly the reports you need
- Integration with existing BI infrastructure
- No new vendor relationships or contracts
Disadvantages:
- Requires 40-80 hours of consultant or internal analyst time for initial build
- Lacks pricing-specific features like waterfall analysis or elasticity modeling
- Ongoing maintenance as data sources and requirements change
Budget $10K-$20K for initial dashboard development plus $2K-$5K annually for maintenance.
Pricing Diagnostics (One-Time)
Before committing to ongoing analytics subscriptions, run a one-time diagnostic to understand baseline pricing performance and quantify improvement opportunities.
Pryse provides self-serve margin diagnostics for $1,499. Upload your transaction CSV, receive a complete analysis within 24 hours showing:
- Current margin by product and customer (invoice and pocket)
- Price waterfall visualization with leakage quantification
- Top 20 margin improvement opportunities ranked by $ impact
- Underpriced products and excessive discount patterns
Most companies identify $100K-$1M in recoverable margin through diagnostics. If opportunities are small, you've saved $50K+ by not investing in annual analytics software you don't need yet. If opportunities are large, diagnostics provide the business case for investing in ongoing analytics platforms.
Cost-Benefit Analysis
Pricing analytics ROI comes from margin improvement, not cost savings or efficiency gains.
Typical Margin Improvements
Research shows the following margin lift ranges by analytics platform type:
- Enterprise platforms: 1-5% margin improvement through systematic pricing optimization (per Zilliant)
- Mid-market tools: 0.5-2% margin improvement from identifying and fixing obvious leakage
- Excel analytics: 0.5-1.5% margin improvement from top opportunities
- One-time diagnostics: 1-2% margin recovery from implementing quick wins
According to Revology Analytics research on B2B pricing, introducing advanced analytics and other tools to support real-time decision-making can lead to margin increases of between 5 and 10 percent for wholesale distributors.
Break-Even Scenarios
Enterprise platform ($100K annually):
Break-even requires $500K-$1M in margin improvement annually at 1-2% lift. This means you need $50M-$100M in revenue with recoverable pricing problems (underpricing, discount leakage, customer-specific pricing gaps).
Mid-market tool ($25K annually):
Break-even requires $125K-$250K in margin improvement annually at 0.5-1% lift. This means $25M-$50M in revenue with identifiable margin leakage.
Basic reporting ($5K annually):
Break-even requires $25K-$50K in benefit annually. Any company with $5M+ revenue and pricing managed manually should clear this threshold easily.
One-time diagnostic ($1,499):
Break-even requires recovering $7K-$15K from top recommendations. Any company with $2M+ revenue and pricing complexity meets this threshold.
Hidden Costs
Software subscription isn't the only cost. Budget for:
- Implementation: Data integration, configuration, and training (20-100 hours depending on platform)
- Ongoing data management: Monthly data quality checks and validation (5-10 hours monthly)
- Analysis and decision-making: Interpreting insights and recommending actions (10-20 hours monthly)
- User training: Initial training plus ongoing as team members change
- Opportunity cost: Leadership and team time during implementation
Companies that budget only for software subscriptions but not implementation and ongoing operation typically abandon platforms within 12 months due to poor adoption.
Leading Pricing Analytics Platforms
Here's a detailed comparison of market-leading platforms based on 2026 capabilities.
PROS (Enterprise)
Best for: Large enterprises with complex pricing across industries
Capabilities:
- AI-powered pricing and revenue optimization platform
- Dynamic pricing decisions across industries and channels
- Advanced predictive analytics using machine learning
- Prescriptive recommendations for price changes
- Real-time integration with ERPs and CPQ systems
Pricing: Enterprise subscription model with custom pricing typically starting at $50,000+ annually based on users, modules, and implementation complexity.
Typical customers: Fortune 500 manufacturers, distributors, and service companies.
According to Gitnux's ranking, PROS offers an AI-powered platform enabling dynamic pricing decisions across industries with enterprise-level capabilities.
Pricefx (Enterprise)
Best for: Mid-market to enterprise B2B companies
Capabilities:
- Cloud-native pricing platform with modular architecture
- CPQ, optimization, analytics, and discount management
- Price elasticity modeling and customer segmentation
- Waterfall analysis and AI-driven simulations
- Can start with analytics and add optimization later
Pricing: Custom quotes starting at $50K+ annually depending on modules and scale.
Typical customers: B2B manufacturers and distributors from $50M to multi-billion revenue.
According to Gitnux, Pricefx provides advanced tools like price elasticity modeling, customer segmentation, waterfall analysis, and AI-driven simulations to uncover pricing insights and drive revenue growth.
Vendavo (Enterprise)
Best for: Complex B2B distribution and manufacturing
Capabilities:
- Enterprise-grade revenue management and pricing solution
- Deal management, margin analysis, and pricing guidance
- Strong in distribution vertical with channel complexity
- Customer-specific pricing and contract management
- Rebate and promotional management
Pricing: Custom quotes, typically $100K-$300K annually for mid-market to enterprise.
Typical customers: Large distributors, industrial manufacturers, chemical companies.
Zilliant (Enterprise)
Best for: B2B companies with large SKU catalogs
Capabilities:
- AI-driven pricing guidance and optimization
- Manages complete pricing lifecycle from list to deals
- Industry focus on chemicals, building materials, distribution
- Strong analytics for 10,000+ SKU catalogs
- Proprietary analytics analyzing complex B2B pricing dynamics
Pricing: Custom quotes starting at $75K+ annually.
Typical customers: B2B distributors and manufacturers with pricing complexity.
According to Zilliant's product information, proprietary pricing software analyzes complex manufacturing and B2B pricing dynamics to deliver continuous price guidance by SKU, customer segment, and market, adapting in real-time to cost changes, demand shifts, and competitive pressures.
Getting Started with Pricing Analytics
Most companies should start with diagnostics or Excel analysis before committing to analytics subscriptions.
Step 1: Run a Baseline Analysis
Export 12 months of transaction data from your ERP (SKU, customer, price, volume, cost). Analyze in Excel or through a diagnostic service to identify:
- Your current margin by product and customer (invoice and pocket)
- Where margin leakage occurs (discounts, rebates, freight, terms)
- How much opportunity exists in your top 20 issues
- Whether pricing complexity justifies dedicated software
If you can't identify $50K+ in recoverable margin through basic analysis, you don't need ongoing analytics software yet. Fix the obvious problems first.
Step 2: Quantify Complexity
Assess your pricing decision volume:
- How many active SKUs?
- How many customers with unique pricing terms?
- How many pricing decisions monthly (price updates, quote approvals)?
- How much time do you spend monthly on pricing analysis?
Under 1,000 SKUs with simple pricing: Excel works fine.
1,000-10,000 SKUs with moderate complexity: Mid-market analytics tool.
10,000+ SKUs with high complexity: Enterprise analytics platform.
Step 3: Confirm Organizational Readiness
Before buying software, validate:
- Leadership will act on analytics insights (not just analyze)
- Pricing authority exists to implement recommended changes
- Data quality is sufficient (or budget exists to improve it)
- 1-2 people can dedicate 10-20 hours monthly to analytics
- Sales team will accept data-driven pricing decisions
Analytics without organizational readiness produces shelf-ware. Software doesn't fix organizational problems—it amplifies what you already do well.
Step 4: Select and Implement
Once you've confirmed opportunity, complexity justifies investment, and organization is ready:
For enterprise platforms:
- Request demos from PROS, Vendavo, Pricefx, and Zilliant
- Budget 2-3 months for vendor selection process
- Plan 3-6 months for implementation
- Expect $50K-$200K annually
For mid-market tools:
- Request trials from Power BI consultants or mid-market analytics vendors
- Budget 4-6 weeks for vendor selection
- Plan 1-2 months for implementation
- Expect $10K-$50K annually
For diagnostics:
- Upload CSV to Pryse
- Receive analysis in 24 hours
- Implement top recommendations in 30-60 days
- Cost $1,499 one-time
Next Steps
Before evaluating analytics vendors, understand your baseline pricing performance. Most companies discover significant margin leakage they didn't know about through basic analysis.
Start with a pricing diagnostic. For $1,499, Pryse provides comprehensive margin analysis within 24 hours from CSV upload. You'll learn:
- Your actual margin by product and customer (most companies are surprised)
- Where margin leaks across the price waterfall
- Whether Excel, mid-market tools, or enterprise platforms make sense for your complexity
- The business case for investing in ongoing analytics software
Start with diagnostics. Invest in software once you've confirmed the opportunity, organizational readiness, and clear ROI path.
For companies ready to explore pricing optimization beyond analytics, see our complete pricing optimization guide covering strategy, organizational design, and implementation best practices.
Sources
- Gitnux: Top 10 Best Pricing Analytics Software of 2026
- Orb: The 8 Best Pricing Analytics Software in 2025 to Grow Revenue
- DealHub: What is Pricing Analytics?
- Buynomics: AI Pricing Tool Comparison for 2026
- 7Learnings: Choosing the Best Pricing Software in 2026
- Zilliant: An In-Depth Overview of Pricing Analytics
- Zilliant: The Power of Pricing Analytics in B2B Industries
- Pricefx: Overcoming B2B Pricing Complexity with AI
- Revology Analytics: Dynamic Pricing for B2B
- Copperberg: Dynamic Pricing in B2B Manufacturing
Last updated: February 23, 2026
Frequently Asked Questions

Want to analyze your entire product catalog?
Pryse automatically identifies margin leakage across thousands of SKUs. Upload your data and find hidden profit in 24 hours.
One-time $1,499 diagnostic. No subscription required.