How to Calculate Margin in Excel: Formulas with Examples
Step-by-step Excel formulas for calculating gross margin, net margin, and markup-to-margin conversion. Includes cell references and common mistakes.
The margin formula in Excel is straightforward: subtract cost from revenue, then divide by revenue.
= ( Revenue - Cost ) / RevenueWith cell references where B2 contains revenue and C2 contains cost:
= ( B2 - C2 ) / B2The result is a decimal. A value of 0.25 means 25% margin. Format the cell as percentage to display it correctly.
This guide covers the exact Excel formulas for gross margin, net profit margin, and the markup-to-margin conversion that trips up most users.
Gross Margin Formula in Excel
Gross margin measures what percentage of revenue remains after subtracting the direct cost of goods sold. It's the most common margin calculation for product-based businesses.
The Formula
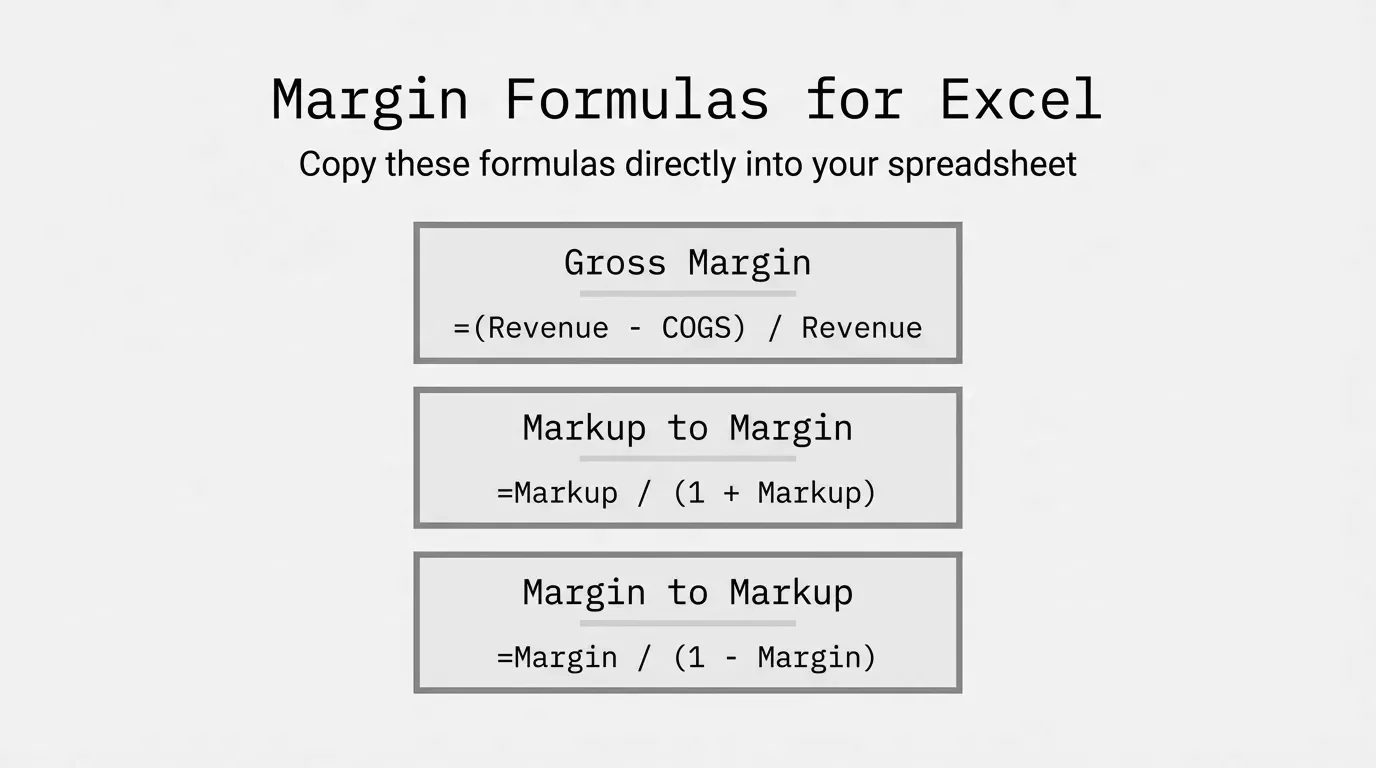
= ( Revenue - COGS ) / RevenueIn Excel with revenue in B2 and cost of goods sold in C2:
= ( B2 - C2 ) / B2Step-by-Step Example
A distributor sells a product for $85. The product cost $59.50.
| Cell | Value | Description |
|---|---|---|
| B2 | 85 | Revenue (selling price) |
| C2 | 59.50 | Cost of goods sold |
| D2 | =( B2 - C2 ) / B2 | Margin formula |
The result in D2: 0.30 (or 30% when formatted as percentage)
This means $0.30 of every revenue dollar remains after covering the product cost.
Formatting as Percentage
Excel returns a decimal by default. To display as percentage:
- Select the cell with your margin formula
- Press Ctrl + Shift + % (Windows) or Cmd + Shift + % (Mac)
Or right-click > Format Cells > Percentage > set decimal places.
Net Profit Margin Formula in Excel
Net profit margin accounts for all costs, not just product costs. It shows what percentage of revenue becomes actual profit after everything is paid.
The Formula
= ( Revenue - Total Costs ) / RevenueOr if you already have net income calculated:
= Net Income / RevenueExample with All Costs
| Cell | Value | Description |
|---|---|---|
| B2 | 500,000 | Revenue |
| C2 | 350,000 | Cost of goods sold |
| D2 | 85,000 | Operating expenses |
| E2 | 15,000 | Interest and taxes |
| F2 | =( B2 - C2 - D2 - E2 ) / B2 | Net margin formula |
The result: 0.10 (10% net profit margin)
Out of $500,000 in revenue, $50,000 remains as profit after all expenses.
Markup to Margin Conversion in Excel
Markup and margin are different numbers. A 50% markup does not equal 50% margin. Getting this wrong causes pricing errors.
Markup is calculated on cost: how much you add to cost to get price.
Margin is calculated on price: what percentage of the price is profit.
Conversion Formulas
Markup to Margin:
= Markup / ( 1 + Markup )Margin to Markup:
= Margin / ( 1 - Margin )Conversion Table
| Markup | Margin | Excel Formula (Markup to Margin) |
|---|---|---|
| 20% | 16.7% | =0.20/(1+0.20) |
| 25% | 20.0% | =0.25/(1+0.25) |
| 33% | 25.0% | =0.33/(1+0.33) |
| 50% | 33.3% | =0.50/(1+0.50) |
| 100% | 50.0% | =1.00/(1+1.00) |
Example
Your purchasing team reports a 40% markup on a product line. What's the actual margin?
= 0.40 / ( 1 + 0.40 ) = 0.286The margin is 28.6%, not 40%. If you quoted customers expecting 40% margin, you're 11 points short.
Building a Margin Calculation Worksheet
For analyzing multiple products, set up a structured worksheet.
Column Setup
| Column | Header | Purpose |
|---|---|---|
| A | SKU | Product identifier |
| B | Product | Name |
| C | Revenue | Selling price or total sales |
| D | COGS | Cost of goods sold |
| E | Gross Profit | Revenue minus COGS |
| F | Gross Margin % | Profit as percentage of revenue |
Formulas for Row 2
Gross Profit (E2):
= C2 - D2Gross Margin % (F2):
= E2 / C2Copying Formulas Down
- Enter formulas in row 2
- Select cells E2:F2
- Double-click the fill handle (small square at bottom-right of selection)
Excel copies the formulas to all rows with data, adjusting cell references automatically.
Handling Divide-by-Zero Errors
Products with zero revenue cause #DIV/0! errors. Wrap margin formulas in IFERROR:
= IFERROR( E2 / C2, 0 )This returns 0 instead of an error when revenue is zero.
Common Excel Margin Mistakes
Mistake 1: Dividing by Cost Instead of Revenue
Wrong (this calculates markup, not margin):
= ( B2 - C2 ) / C2Correct (margin divides by revenue):
= ( B2 - C2 ) / B2Mistake 2: Forgetting Parentheses
Wrong (Excel calculates C2/B2 first due to order of operations):
= B2 - C2 / B2Correct (parentheses ensure subtraction happens first):
= ( B2 - C2 ) / B2Mistake 3: Confusing Markup and Margin
If you need 25% margin, you need a 33% markup, not a 25% markup.
| Target Margin | Required Markup |
|---|---|
| 20% | 25% |
| 25% | 33% |
| 30% | 43% |
| 35% | 54% |
| 40% | 67% |
Mistake 4: Using Simple Average Instead of Weighted Average
Adding up margins and dividing by count treats a $100 product the same as a $100,000 product.
Wrong:
= AVERAGE( F2:F100 )Correct (weighted by revenue):
= SUMPRODUCT( F2:F100, C2:C100 ) / SUM( C2:C100 )Calculating Margin Across Product Categories
Use SUMIF to calculate margin by category.
Setup
Add a Category column (G) to your worksheet.
Category Revenue Total
= SUMIF( G:G, "Fasteners", C:C )Category COGS Total
= SUMIF( G:G, "Fasteners", D:D )Category Margin
= ( SUMIF( G:G, "Fasteners", C:C ) - SUMIF( G:G, "Fasteners", D:D ) ) / SUMIF( G:G, "Fasteners", C:C )This calculates the true weighted margin for the Fasteners category, not an average of individual product margins.
When Excel Becomes the Problem
Excel works fine for margin calculations with a few hundred products. The formulas above handle straightforward analysis. But Excel has real limits.
Scale issues: Above 5,000 SKUs, Excel slows down. Recalculating formulas takes noticeable time. Finding specific products requires constant filtering.
Data combination: When transaction data lives in your ERP, customer data in a CRM, and cost data in a separate system, someone has to export and merge everything manually. That takes hours every time you want current numbers.
Historical analysis: Tracking how margins changed over time, by customer, by product category, across different sales reps, across the company, becomes a pivot table nightmare. The questions you can ask are limited by what Excel can reasonably handle.
Snapshot vs. real-time: Excel shows where margins were when you exported the data. It can't show the margin impact of a price change before you approve it, or how today's orders are affecting this week's blended margin.
For deeper Excel techniques and margin analysis frameworks, see our guide on margin analysis in Excel and the complete margin analysis guide.
Quick Reference: Margin Formulas
| Calculation | Excel Formula |
|---|---|
| Gross Margin % | =( Revenue - COGS ) / Revenue |
| Net Profit Margin % | =( Revenue - All Costs ) / Revenue |
| Markup to Margin | =Markup / ( 1 + Markup ) |
| Margin to Markup | =Margin / ( 1 - Margin ) |
| Weighted Avg Margin | =SUMPRODUCT( Margins, Revenues ) / SUM( Revenues ) |
| Category Margin | =( SUMIF for Revenue - SUMIF for COGS ) / SUMIF for Revenue |
Format all results as percentage. Use IFERROR to handle divide-by-zero cases.
Last updated: January 18, 2026
Frequently Asked Questions

Want to analyze your entire product catalog?
Pryse automatically identifies margin leakage across thousands of SKUs. Upload your data and find hidden profit in 24 hours.
One-time $1,499 diagnostic. No subscription required.