Margin Analysis Template: Fields, Formulas, and Structure
Free margin analysis template with product, customer, and period structures. Includes field definitions, formulas, and ERP export mapping.
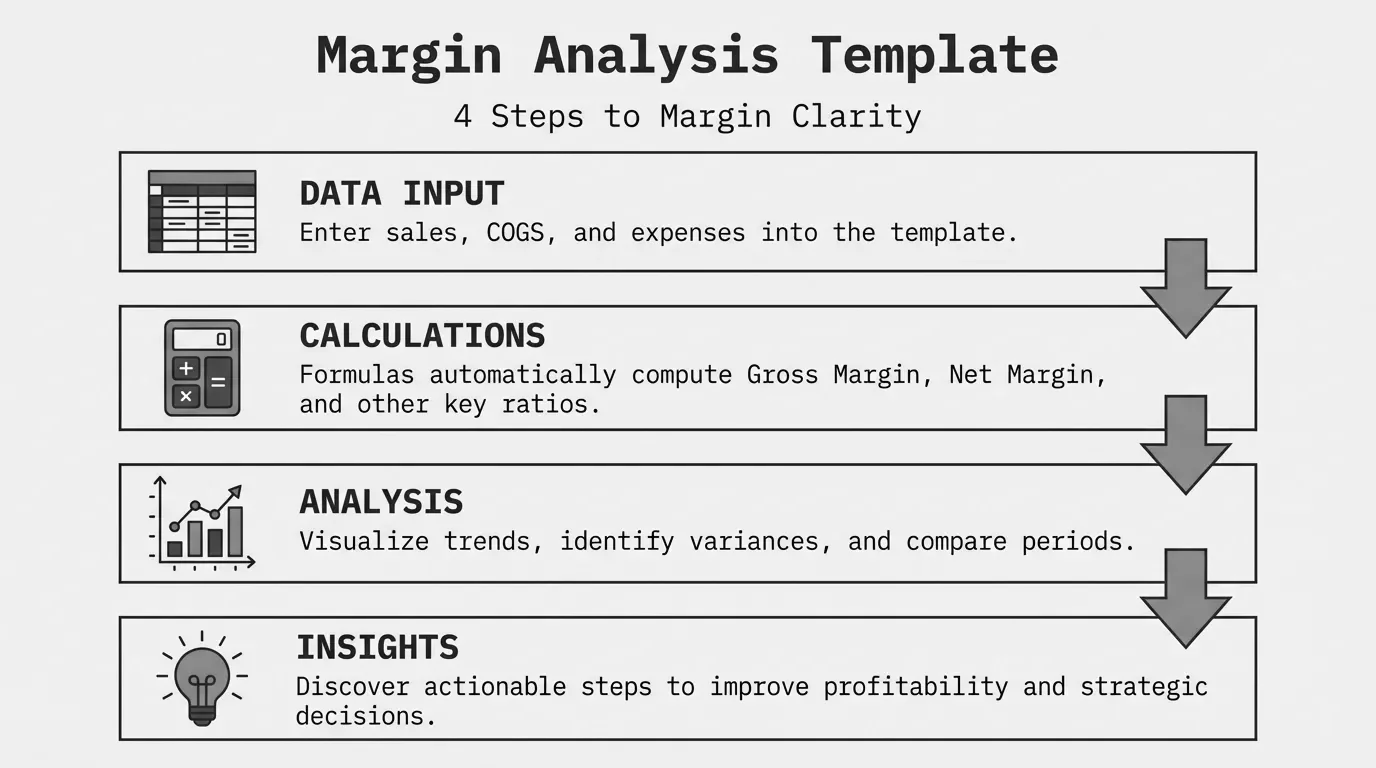
A margin analysis template organizes your revenue and cost data into a structure that reveals profitability by product, customer, or time period. The template itself is straightforward. The value comes from what you put into it and how you segment the output.
This post covers the fields your template needs, three common template structures, the formulas that power the calculations, and how to populate it from ERP exports. Skip the generic spreadsheet downloads and build something that matches your actual data.
Essential Fields for a Margin Analysis Template
Every margin analysis template needs these core fields. The specific column names vary by ERP system, but the data types remain consistent.
Transaction-Level Fields
| Field Name | Data Type | Description | Example |
|---|---|---|---|
| Transaction ID | Text | Invoice or order number | INV-2026-00142 |
| Date | Date | Transaction date | 2026-01-15 |
| Customer ID | Text | Customer account number | CUST-4521 |
| Customer Name | Text | Customer display name | Acme Manufacturing |
| Product SKU | Text | Item identifier | WDG-1200-BLK |
| Product Description | Text | Item name | Widget 1200 Black |
| Product Category | Text | Product grouping | Widgets |
| Quantity | Number | Units sold | 250 |
| Unit Price | Currency | Price per unit | $12.50 |
| Revenue | Currency | Extended price (Qty x Unit Price) | $3,125.00 |
| Unit Cost | Currency | Cost per unit | $8.75 |
| COGS | Currency | Extended cost (Qty x Unit Cost) | $2,187.50 |
Calculated Fields
| Field Name | Formula | Description |
|---|---|---|
| Gross Profit | Revenue - COGS | Dollar profit before operating costs |
| Gross Margin % | (Revenue - COGS) / Revenue x 100 | Percentage margin on the transaction |
| Margin Variance | Actual Margin - Target Margin | Deviation from target |
For pocket margin analysis, add these fields:
| Field Name | Data Type | Description |
|---|---|---|
| Volume Rebate | Currency | Rebate dollars given |
| Early Pay Discount | Currency | Payment term discounts taken |
| Freight Cost | Currency | Shipping absorbed |
| Pocket Price | Currency | Revenue minus all deductions |
| Pocket Margin % | (Pocket Price - COGS) / Pocket Price x 100 | True realized margin |
Product-Level Margin Template Structure
Use this structure when analyzing margin by product or product category. It answers: which products generate the most profit, and which ones drag down overall margin?
Template Layout
Columns:
- Product SKU
- Product Description
- Product Category
- Total Revenue
- Total COGS
- Gross Profit
- Gross Margin %
- Units Sold
- Avg Unit Price
- Avg Unit Cost
- Margin vs Target
- Contribution to Total Profit %
Rows: One row per SKU or category, depending on analysis level.
Sample Product Margin Calculation
Product Gross Margin = SUM(Revenue for SKU) - SUM(COGS for SKU) / SUM(Revenue for SKU) x 100
For a product with $125,000 in annual revenue and $87,500 in cost:
Gross Profit = $125,000 - $87,500 = $37,500
Gross Margin = $37,500 / $125,000 x 100 = 30%
What to Look For
Sort by gross margin percentage to find your highest and lowest performers. Then sort by gross profit contribution to see which products generate the most total dollars.
A product with 45% margin but $5,000 in annual revenue matters less than one with 25% margin and $500,000 in revenue. Your template should surface both views.
Flag products below your minimum margin threshold. For most distributors, that floor sits around 15-20%. Products consistently below that level need pricing review or discontinuation analysis.
Customer-Level Margin Template Structure
This structure identifies which customers generate profit and which ones erode it. Customer margin analysis often reveals that large accounts have lower margins than mid-size accounts that receive less pricing attention.
Template Layout
Columns:
- Customer ID
- Customer Name
- Customer Segment
- Total Revenue
- Total COGS
- Gross Profit
- Gross Margin %
- Transaction Count
- Avg Order Size
- Revenue Rank
- Margin Rank
- Margin vs Segment Avg
Rows: One row per customer.
Sample Customer Margin Calculation
Customer Gross Margin = (Total Customer Revenue - Total Customer COGS) / Total Customer Revenue x 100
A customer with $400,000 in purchases and $296,000 in associated costs:
Gross Profit = $400,000 - $296,000 = $104,000
Gross Margin = $104,000 / $400,000 x 100 = 26%
What to Look For
Create a scatter plot with revenue on the X-axis and margin percentage on the Y-axis. You want customers in the upper-right quadrant: high revenue, high margin.
Customers in the lower-right (high revenue, low margin) need pricing review. They buy enough to matter, but the current deal structure leaves money on the table.
Customers in the upper-left (low revenue, high margin) might be candidates for growth focus. They accept your pricing. Can you sell them more?
Compare margin by customer segment. If enterprise accounts average 22% margin while mid-market averages 28%, your enterprise discounting may have drifted too far.
Period Comparison Template Structure
This structure tracks margin trends over time. It catches erosion before it becomes a crisis and validates the impact of pricing changes.
Template Layout
Columns:
- Period (Month/Quarter/Year)
- Total Revenue
- Total COGS
- Gross Profit
- Gross Margin %
- Operating Expenses
- Operating Margin %
- Period-over-Period Change
- Year-over-Year Change
Rows: One row per period.
Sample Period Comparison
Margin Change = Current Period Margin % - Prior Period Margin %
YoY Change = Current Period Margin % - Same Period Last Year Margin %
| Period | Revenue | COGS | Gross Profit | Gross Margin |
|---|---|---|---|---|
| Q1 2025 | $4,200,000 | $3,024,000 | $1,176,000 | 28.0% |
| Q2 2025 | $4,350,000 | $3,175,500 | $1,174,500 | 27.0% |
| Q3 2025 | $4,100,000 | $3,034,000 | $1,066,000 | 26.0% |
| Q4 2025 | $4,500,000 | $3,375,000 | $1,125,000 | 25.0% |
This trend shows margin declining 3 percentage points over the year despite revenue growth. On $17M in annual revenue, that 3-point decline represents $510,000 in lost profit.
What to Look For
Declining margin over consecutive periods warrants investigation. Common causes: cost increases not passed through, product mix shift toward lower-margin items, or creeping discounts.
Compare against the same period in prior years to account for seasonality. Q4 margin might naturally dip if you run year-end promotions.
Tie margin changes to specific events. Did you launch a new customer pricing tier in March? Did a supplier raise costs in July? The template should help you connect cause and effect.
Populating the Template from ERP Exports
Most ERP systems export transaction data to CSV or Excel. The process involves mapping ERP field names to your template structure.
Common ERP Field Mappings
| Template Field | NetSuite | SAP B1 | Microsoft D365 |
|---|---|---|---|
| Transaction ID | Document Number | DocNum | Sales Order Number |
| Date | Transaction Date | DocDate | Invoice Date |
| Customer ID | Customer Internal ID | CardCode | Customer Account |
| Product SKU | Item Name/Number | ItemCode | Product Number |
| Revenue | Amount | LineTotal | Revenue |
| COGS | Cost | StockValue | COGS |
Export Process
-
Pull transaction-level detail. Summary reports hide the variance you need to find. Get individual invoice lines.
-
Include all cost components. Standard cost from the item master is a starting point. Actual landed cost gives more accurate margin.
-
Add customer and product attributes. Include segment, category, and tier fields so you can slice the data.
-
Set the date range. Pull at least 12 months for trend analysis. Include prior year for comparison.
-
Validate totals. Sum your export and compare to financial statements. Discrepancies mean missing transactions or cost allocation issues.
Data Cleaning Steps
Before analysis, clean the data:
- Remove cancelled or voided transactions
- Exclude internal transfers and samples
- Handle returns (either net them against sales or analyze separately)
- Fill missing cost data with standard costs
- Standardize customer and product names (ACME vs Acme vs acme)
Common Template Mistakes
Using Summary Data Instead of Transactions
A report showing total revenue and COGS by customer gives you customer margin. But it hides which products drove that margin. Transaction-level data lets you drill into product mix within each customer.
Missing Cost Components
Your template shows 30% gross margin. Actual margin is 22% after accounting for freight, rebates, and handling costs. If you only track invoice-level costs, you overstate profitability.
Inconsistent Time Periods
Comparing March (31 days) to February (28 days) without normalization skews trend analysis. Use same-day counts or normalize to daily/weekly rates.
Static Snapshots Instead of Live Data
A template updated quarterly shows you what happened three months ago. By then, margin erosion has compounded. The more frequently you refresh, the faster you catch problems.
No Segmentation
Company-wide margin is a lagging indicator. Without product, customer, and time segmentation, you know the number but not the cause.
When a Template Is Not Enough
Spreadsheet-based margin analysis works for many mid-market companies. It stops working when:
Transaction volume exceeds manageability. More than 50,000 lines per period makes Excel sluggish and pivot tables unwieldy.
Multiple users need the same data. Version control in shared spreadsheets creates confusion. Who has the latest numbers?
You need real-time visibility. Monthly exports and manual refreshes mean you see problems after they have compounded.
Pocket margin requires connecting multiple systems. Pulling invoice data from ERP, rebates from AP, freight from logistics, and payment terms from AR into one spreadsheet becomes a maintenance burden.
Analysis needs to drive action. Identifying a problem customer is step one. Triggering a pricing review, tracking the outcome, and measuring improvement requires workflow that spreadsheets do not provide.
For companies managing 5,000+ SKUs across hundreds of customers, purpose-built margin analysis tools automate what is painful in Excel. The template gets you started. Scale demands something more.
For a complete framework on margin types and analysis methods, see our margin analysis guide.
Building Your Template
Start with the transaction-level structure. Add calculated margin columns. Build a pivot table for product, customer, and period views.
Run it monthly. Look for outliers. Ask why a product that averaged 28% margin last year now runs at 23%. Ask why your third-largest customer has your lowest margin.
The template is a tool. The insight comes from using it consistently and acting on what you find.
Last updated: January 12, 2026
Frequently Asked Questions

Want to analyze your entire product catalog?
Pryse automatically identifies margin leakage across thousands of SKUs. Upload your data and find hidden profit in 24 hours.
One-time $1,499 diagnostic. No subscription required.