What Is a Good Net Profit Margin? Industry Benchmarks and Standards
A good net profit margin is 10% for most businesses. See industry benchmarks from NYU Stern data and learn what affects your target.
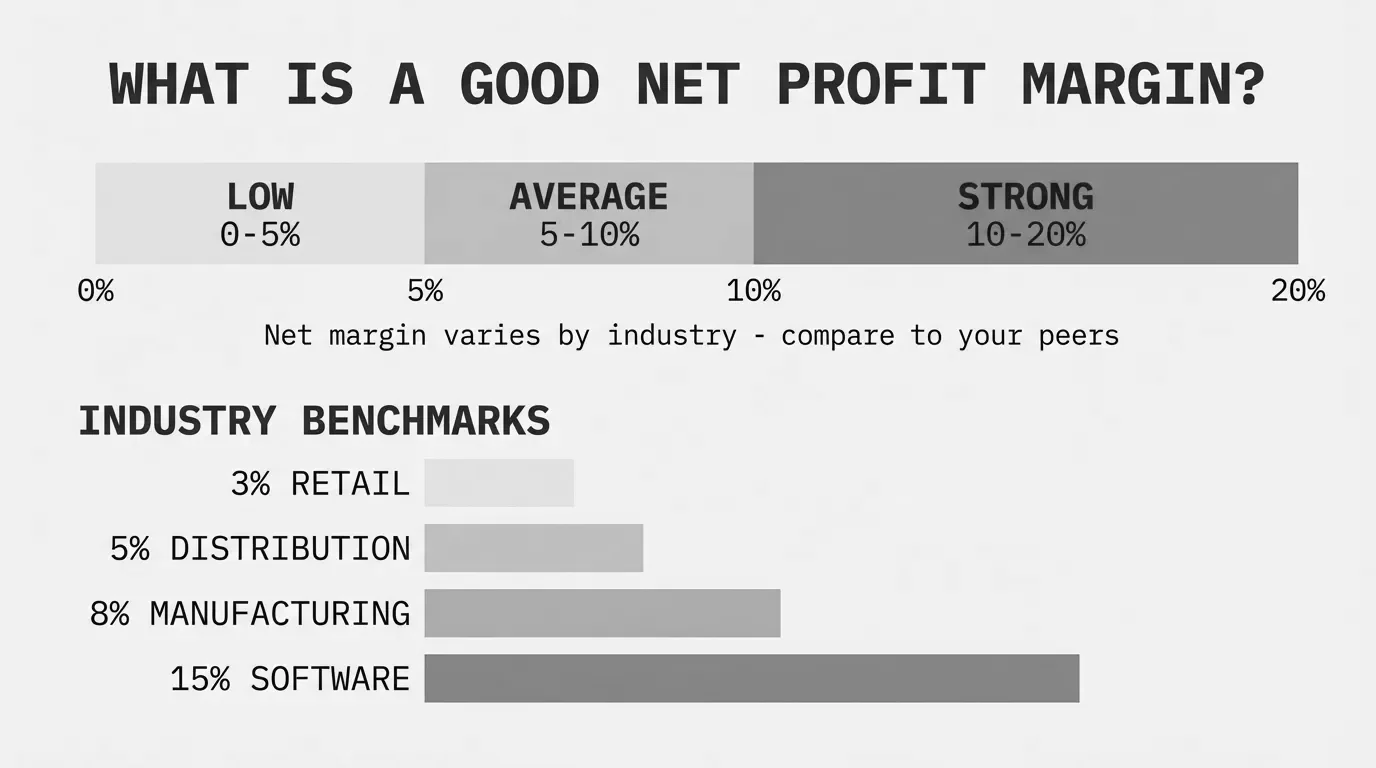
A good net profit margin is 10% for most businesses. This means you keep $0.10 of every revenue dollar after paying all expenses.
That's the simple answer. The real answer depends on your industry, company size, and growth stage. A 5% margin that would bankrupt a software company is a home run for a grocery distributor.
The Quick Reference
Here's the general framework most financial analysts use:
| Net Profit Margin | Assessment |
|---|---|
| Below 5% | Concerning - investigate causes |
| 5% - 10% | Acceptable for most industries |
| 10% - 20% | Healthy - above average performance |
| Above 20% | Excellent - strong competitive position |
These are guidelines, not rules. Industry context changes everything.
Net Profit Margin by Industry (2026 Data)
According to NYU Stern's January 2026 dataset covering 5,994 firms, here are actual net profit margins by industry:
| Industry | Net Profit Margin |
|---|---|
| Machinery | 10.58% |
| Metals & Mining | 10.52% |
| Building Materials | 7.42% |
| Electronics (General) | 6.47% |
| Retail (Distributors) | 6.05% |
| Packaging & Container | 4.48% |
| Food Processing | 2.82% |
| Oilfield Services/Equipment | 2.34% |
| Food Wholesalers | 1.17% |
| Auto Parts | 0.72% |
The spread is massive. A machinery manufacturer at 8% net margin is underperforming their industry. A food wholesaler at 3% is outperforming by 2.5x.
This is why comparing your margin to "10% is good" without industry context leads to bad decisions.
What Makes a "Good" Margin for Your Business
Four factors determine what net profit margin you should target:
1. Your Industry
Industry structure sets the baseline. Capital-intensive industries with commodity products (auto parts, food distribution) operate on thin margins because competition is fierce and differentiation is limited.
Industries with intellectual property, recurring revenue, or high switching costs (software, specialized manufacturing) command higher margins.
The test: Look up your specific industry in the NYU Stern dataset or industry association benchmarks. Your "good" margin is the industry average plus 2-3 percentage points.
2. Your Company Size
The relationship between size and margin isn't linear, but patterns exist:
Smaller companies ($5M-$20M revenue) often have higher percentage margins because overhead is lean. The owner handles multiple roles. Systems are simple.
Mid-market companies ($20M-$200M revenue) frequently see margin compression. You've added management layers, compliance costs, and infrastructure before reaching the scale where those investments pay off.
Larger companies ($200M+) can achieve margin expansion through purchasing power, operational leverage, and market position.
If your company recently crossed $50M in revenue and margins dropped, that's common. The question is whether you're building toward scale benefits or just adding cost.
3. Your Growth Stage
Growth and profitability trade off, especially in the short term.
High-growth companies (25%+ annual revenue growth) often run lower margins intentionally. They're investing in sales teams, market expansion, and capacity. A 3% margin while growing 40% annually might be the right strategy.
Mature companies (5-10% growth) should show higher margins. The investment phase is over. If margins aren't expanding as growth slows, something is wrong with the business model.
Declining companies often show artificially high margins temporarily as they cut costs faster than revenue falls. This isn't sustainable.
4. Your Capital Structure
Debt load affects net margin directly through interest expense. A company with $5M in debt at 8% interest pays $400K annually before calculating net profit.
Two identical operations with different financing structures will show different net margins. When benchmarking, consider whether your debt level is typical for your industry.
Net Profit Margin vs. Gross Margin
Don't confuse these two metrics. They measure different things:
Gross Margin = (Revenue - COGS) / Revenue
Net Profit Margin = (Revenue - All Expenses) / Revenue
| Metric | What It Measures | Typical Range |
|---|---|---|
| Gross Margin | Production/sourcing efficiency | 20% - 50% |
| Net Profit Margin | Overall business profitability | 2% - 15% |
Gross margin shows how well you buy or make products. Net margin shows how well you run the entire business.
A company with 35% gross margin and 3% net margin has a production efficiency problem or an overhead problem. The 32-point gap between the two margins is where operating costs, interest, and taxes live.
For distribution and manufacturing companies, we typically see:
- Gross margins: 20-35%
- Net margins: 3-10%
If your gap is wider than industry norms, dig into operating expenses.
Warning Signs Your Margin Is Too Low
Net margin below 5% deserves investigation. Below 3% is a warning light. Here's what to look for:
Pricing problems
- Discounts and allowances growing faster than revenue
- Customer-specific pricing that hasn't been reviewed in years
- Cost increases not passed through to customers
- Sales reps with too much pricing discretion
Cost problems
- Overhead growing faster than revenue
- Duplicate systems and subscriptions
- Underutilized warehouse or production capacity
- Inventory carrying costs from slow-moving stock
Structural problems
- Low-margin customers dominating the mix
- Product portfolio tilted toward commodity items
- Undifferentiated position inviting price competition
The most common issue we see in mid-market distribution and manufacturing: pricing leakage. Companies leave 2-5% of margin on the table through inconsistent pricing, stale customer deals, and unmeasured discounts.
How to Improve Net Profit Margin
Start with the highest-leverage fixes:
1. Fix Pricing First
Pricing changes drop straight to the bottom line. A 1% price increase on $50M revenue adds $500K to net profit if volume holds steady.
Run a margin analysis by customer and product. Find where you're giving away margin through:
- Legacy pricing that doesn't reflect current costs
- Volume discounts that don't match actual volumes
- Customer-specific deals that haven't been renegotiated
2. Reduce Cost of Goods Sold
Every point of COGS reduction improves both gross and net margin.
- Consolidate suppliers to hit volume rebate tiers
- Audit landed costs (freight, duties, handling)
- Negotiate annual price holds with key vendors
- Review product mix for low-margin SKUs to discontinue
3. Cut Operating Overhead
Look for costs that grew during good times and never got trimmed:
- Software subscriptions (audit what you actually use)
- Headcount ratios (revenue per employee)
- Facilities costs (square footage per revenue dollar)
- Professional services (legal, accounting, consulting)
4. Optimize Product and Customer Mix
Not all revenue is equal. A $1M customer at 2% margin is less valuable than a $500K customer at 12% margin.
Analyze contribution margin by customer and product segment. Shift sales focus toward higher-margin opportunities. Consider firing unprofitable customers or repricing them.
What "Good" Looks Like: Examples
Electrical distributor, $45M revenue
- Industry average net margin: 6-8%
- Current margin: 4.2%
- Assessment: Below average. Investigate pricing and overhead.
- Target: 7%+
Food processing company, $28M revenue
- Industry average net margin: 2-3%
- Current margin: 4.1%
- Assessment: Strong performer, well above average.
- Target: Maintain and protect
Industrial machinery manufacturer, $65M revenue
- Industry average net margin: 10-11%
- Current margin: 8.5%
- Assessment: Slightly below average for the sector.
- Target: 11%+
Tracking Margin Over Time
A single margin snapshot tells you little. Track net margin quarterly and look for:
Trend direction: Is margin improving, flat, or declining over 8-12 quarters?
Seasonality: Some businesses have natural margin variation by quarter. Know your pattern.
Correlation with growth: Are you trading margin for growth intentionally, or is margin eroding while growth also slows?
Variance from plan: Budget a target margin and measure actual versus expected. Investigate gaps.
The Bottom Line
A good net profit margin is one that:
- Meets or exceeds your industry average
- Supports your growth strategy
- Improves over time as you scale
- Generates enough cash to reinvest and service debt
For most distribution and manufacturing companies in the $20M-$200M range, that means targeting 5-10% net margin with a goal of reaching the higher end.
If you're below 5%, pricing is usually the fastest lever. Most companies we analyze find 2-5 percentage points of margin hiding in pricing inconsistencies that accumulated over years.
For a deeper look at analyzing margins across your business, see our complete guide to margin analysis.
Last updated: January 17, 2026
Frequently Asked Questions

Want to analyze your entire product catalog?
Pryse automatically identifies margin leakage across thousands of SKUs. Upload your data and find hidden profit in 24 hours.
One-time $1,499 diagnostic. No subscription required.