Gross Margin vs Operating Margin: Which Metric Actually Matters
Gross margin measures production efficiency. Operating margin measures overall business efficiency. Learn when to use each and what the gap between them reveals.
Gross margin measures how much you keep after paying for the product itself. Operating margin measures how much you keep after paying for the product plus all the costs of running the business.
That distinction determines which metric you should use and when.
The Core Difference in One Table
| Aspect | Gross Margin | Operating Margin |
|---|---|---|
| Formula | (Revenue - COGS) / Revenue | (Revenue - COGS - OpEx) / Revenue |
| What it measures | Production/purchasing efficiency | Total operational efficiency |
| Costs included | Direct costs only | Direct costs + operating expenses |
| Typical range (distribution) | 15-25% | 3-10% |
| Typical range (manufacturing) | 25-35% | 8-15% |
| Best for | Pricing decisions, supplier negotiations | Business health, investor analysis |
| Can be manipulated by | Cost allocation choices | Expense timing, depreciation methods |
The gap between these two numbers tells you as much as either metric alone.
Gross Margin: The Pricing Efficiency Metric
Gross margin shows the percentage of revenue remaining after subtracting the direct cost of goods sold.
Gross Margin = (Revenue - COGS) / Revenue x 100For a distributor buying products at $70 and selling at $100:
($100 - $70) / $100 x 100 = 30%Gross margin answers the question: "How efficiently do we convert sales into profit before overhead?" It reflects your pricing power, supplier relationships, and product mix.
A detailed breakdown of the calculation is available in our gross margin formula guide.
What Goes Into COGS
Gross margin accuracy depends on proper cost classification. COGS includes:
- Raw materials or purchased inventory
- Direct labor (production workers)
- Manufacturing overhead (factory utilities, equipment)
- Inbound freight
- Packaging materials
COGS excludes indirect costs like sales salaries, marketing, and office rent. Those fall into operating expenses.
Operating Margin: The Business Health Metric
Operating margin shows the percentage of revenue remaining after subtracting both COGS and operating expenses.
Operating Margin = (Revenue - COGS - Operating Expenses) / Revenue x 100Or equivalently:
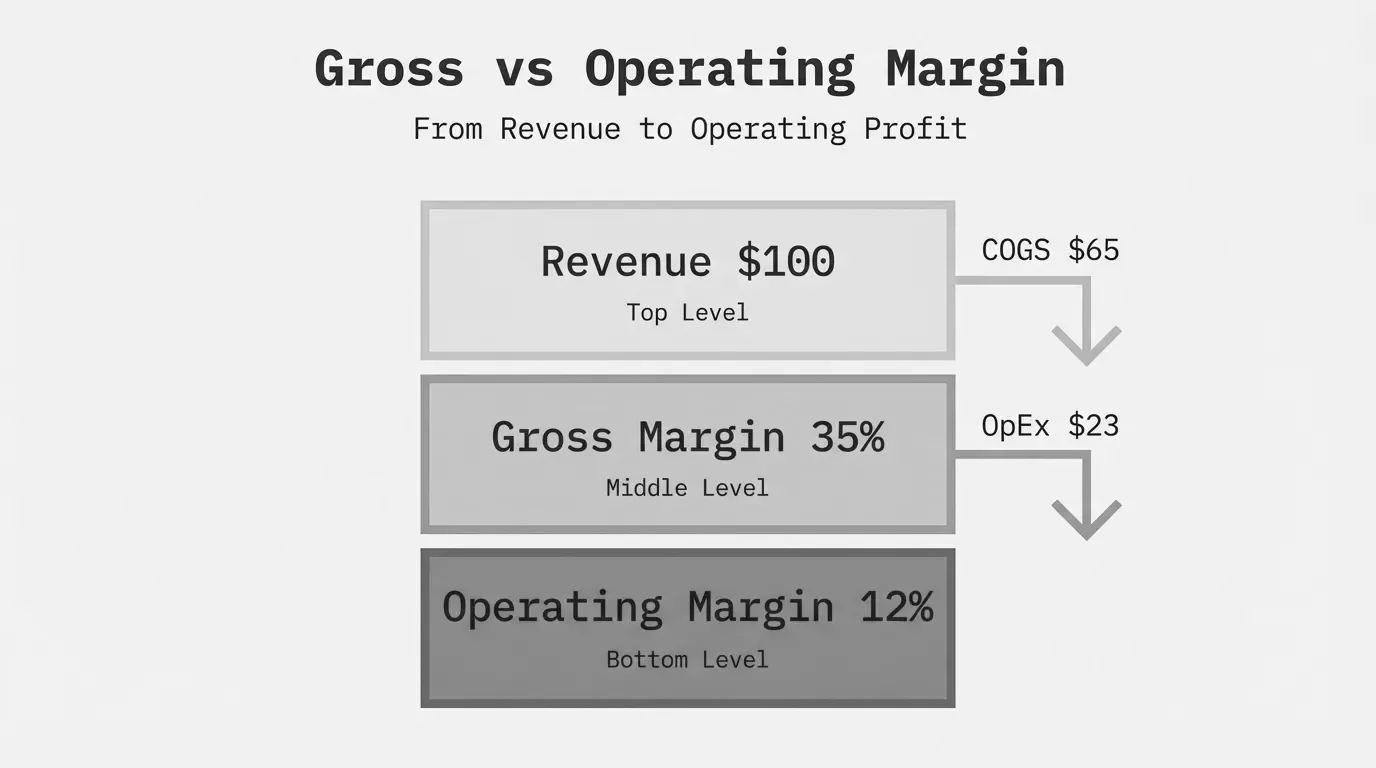
Operating Margin = Operating Income / Revenue x 100Using the same distributor example with $100 revenue, $70 COGS, and $18 in operating expenses:
($100 - $70 - $18) / $100 x 100 = 12%Operating margin answers the question: "How much profit does the core business generate before financing costs and taxes?" It reflects your operational efficiency and cost control.
For the calculation details, see our operating margin formula guide.
What Counts as Operating Expenses
Operating expenses (OpEx) include costs to run the business that are not directly tied to producing or purchasing goods:
- Sales and administrative salaries
- Rent and facilities costs
- Marketing and advertising
- Utilities (office and warehouse)
- Insurance
- Depreciation and amortization
- Professional services (accounting, legal)
Operating expenses exclude interest payments and income taxes. Those come after operating income, which is why operating margin is sometimes called EBIT margin (Earnings Before Interest and Taxes).
Same Company, Both Calculations
Precision Industrial Supply, a $32M electrical components distributor, reported these annual figures:
| Line Item | Amount |
|---|---|
| Revenue | $32,000,000 |
| Cost of Goods Sold | $24,000,000 |
| Operating Expenses | $5,600,000 |
Gross Margin Calculation:
($32,000,000 - $24,000,000) / $32,000,000 x 100 = 25%Operating Margin Calculation:
($32,000,000 - $24,000,000 - $5,600,000) / $32,000,000 x 100 = 7.5%Precision Industrial keeps $0.25 of every sales dollar after product costs, but only $0.075 after running the business. The 17.5 percentage point gap represents their operating expense burden.
The Gap Between Them Matters
The spread between gross margin and operating margin reveals your overhead efficiency.
| Gross Margin | Operating Margin | Gap | What It Means |
|---|---|---|---|
| 25% | 15% | 10 pts | Lean operations, well-controlled overhead |
| 25% | 8% | 17 pts | Typical for mid-market distribution |
| 25% | 3% | 22 pts | Heavy overhead, possible expense bloat |
| 25% | -2% | 27 pts | Operating expenses exceed gross profit |
For distribution and manufacturing companies in the $20M-$200M range, the gap typically runs 12-20 percentage points. Wider gaps suggest opportunities to reduce overhead or signal structural cost problems.
Tracking the gap over time reveals trends:
- Gap widening = Operating expenses growing faster than gross profit
- Gap narrowing = Operational leverage improving
- Stable gap = Costs scaling proportionally with revenue
A $50M manufacturer that grows to $75M should see the gap narrow as fixed costs spread across more revenue. If the gap stays constant or widens, overhead is growing too fast.
What Each Metric Reveals
Gross Margin Diagnostics
High gross margin (30%+ for distribution, 40%+ for manufacturing) indicates:
- Strong pricing power
- Favorable supplier terms
- Premium product positioning
- Low competition in your segments
Low gross margin (below 18% for distribution, below 25% for manufacturing) signals:
- Commodity pricing pressure
- Supplier cost increases not passed through
- Heavy discounting culture
- Product mix weighted toward low-margin items
Operating Margin Diagnostics
High operating margin (12%+ for distribution, 18%+ for manufacturing) indicates:
- Efficient operations
- Good fixed cost leverage
- Disciplined overhead management
- Scale benefits kicking in
Low operating margin (below 5% for distribution, below 8% for manufacturing) signals:
- Overhead bloat
- Underutilized facilities
- Over-staffing relative to revenue
- Revenue decline against fixed costs
Industry Benchmarks Side by Side
| Industry | Gross Margin | Operating Margin | Typical Gap |
|---|---|---|---|
| Wholesale Distribution | 15-25% | 3-8% | 12-17 pts |
| Industrial Manufacturing | 25-35% | 8-15% | 15-20 pts |
| Food Manufacturing | 20-30% | 5-10% | 15-20 pts |
| Electrical Equipment | 28-35% | 10-15% | 15-22 pts |
| Auto Parts Distribution | 18-25% | 4-8% | 14-17 pts |
| Building Materials | 22-30% | 6-12% | 14-20 pts |
Source: Industry composites from S&P Capital IQ and IBISWorld sector reports.
These benchmarks represent medians. Top-quartile performers in each category typically run 3-5 percentage points higher on both metrics. Bottom-quartile companies often show gross margins in range but operating margins significantly below, indicating overhead problems rather than pricing problems.
When to Use Which Metric
Use Gross Margin For:
Pricing decisions - Evaluating whether to accept a deal, offer a discount, or adjust list prices. A sales rep asking for 15% off a product with 22% gross margin needs to understand they're giving away most of the profit.
Product profitability analysis - Identifying which SKUs contribute margin and which drain it. Company-wide gross margin can mask that 30% of products lose money at the gross level.
Supplier negotiations - Quantifying the impact of cost changes. A 3% supplier price increase on a 25% gross margin product drops margin to 22%—an 12% reduction in profitability.
Customer profitability - Understanding which accounts actually make money after product costs. Your largest customer by revenue might be your lowest-margin account.
Use Operating Margin For:
Business valuation - Buyers and investors focus on operating margin (or EBITDA, which is closely related). A business with 15% operating margin commands higher multiples than one with 5%.
Operational benchmarking - Comparing your performance against competitors and industry averages. Operating margin normalizes for differences in capital structure and tax situations.
Expense control - Measuring whether overhead grows proportionally with the business. Operating margin trending down quarter over quarter indicates expense discipline problems.
Strategic planning - Modeling scenarios for expansion, acquisition, or restructuring. Operating margin projections drive cash flow forecasts.
Use Both Together For:
Diagnosing margin problems - Declining operating margin with stable gross margin points to overhead issues. Declining gross margin with stable operating margin points to pricing or cost issues.
Setting improvement targets - A company with 28% gross margin and 6% operating margin has different opportunities than one with 20% gross margin and 10% operating margin. The first needs overhead reduction; the second needs pricing help.
M&A analysis - Acquirers look at both. Strong gross margins suggest pricing power that can be maintained post-acquisition. Strong operating margins suggest well-run operations that might not need restructuring.
The Margin Waterfall
Visualizing how revenue flows to profit helps contextualize both metrics:
| Stage | Amount | % of Revenue |
|---|---|---|
| Revenue | $10,000,000 | 100% |
| Less: COGS | ($7,500,000) | 75% |
| Gross Profit | $2,500,000 | 25% (Gross Margin) |
| Less: Operating Expenses | ($1,600,000) | 16% |
| Operating Income | $900,000 | 9% (Operating Margin) |
| Less: Interest | ($150,000) | 1.5% |
| Less: Taxes | ($187,500) | 1.9% |
| Net Income | $562,500 | 5.6% (Net Margin) |
Each margin level builds on the previous one. Gross margin sets the ceiling for what operating margin can be. Operating margin sets the ceiling for net margin. Problems at the gross margin level cascade through everything below.
Common Mistakes When Comparing These Metrics
Comparing across industries - A 25% gross margin is excellent for distribution but mediocre for manufacturing. Always benchmark against your specific sector.
Ignoring cost allocation - Some companies classify warehouse labor as COGS, others as operating expense. This shifts margin between the two metrics without changing actual profitability. Ensure consistent classification before comparing.
Focusing on one metric only - Gross margin obsession ignores overhead reality. Operating margin obsession can lead to cutting sales staff that drives revenue. Both metrics together tell the full story.
Quarterly swings vs trends - Operating margin can swing 2-3 points quarter to quarter from timing of expenses, seasonal patterns, or one-time costs. Look at trailing twelve-month averages for true performance.
What to Do With This Information
Understanding the difference between gross and operating margin is step one. The harder work is drilling into your transaction data to find where each margin leaks.
Most distribution and manufacturing companies have 3-7 percentage points of gross margin hiding in pricing inconsistencies, customer-level discounting, and product mix problems. They have another 2-4 points of operating margin available through overhead optimization.
Finding these opportunities requires analyzing actual transactions—not just financial statements. What's your gross margin by customer? By product line? By sales rep? How does operating expense per order vary across your customer segments?
If you're running margin analysis in spreadsheets and hitting the limits of what Excel can handle, that's the problem Pryse solves. Upload your data, see your margin breakdown by any dimension, and identify exactly where profitability leaks in 24 hours.
For a complete framework on margin analysis methods, see our margin analysis guide.
Last updated: January 14, 2026
Frequently Asked Questions

Want to analyze your entire product catalog?
Pryse automatically identifies margin leakage across thousands of SKUs. Upload your data and find hidden profit in 24 hours.
One-time $1,499 diagnostic. No subscription required.