Operating Margin Formula: How to Calculate Operating Profit Margin
The operating margin formula explained with examples. Learn how to calculate operating margin and compare to industry benchmarks.
Operating margin measures how much profit your business keeps from each dollar of revenue after paying both production costs and operating expenses.
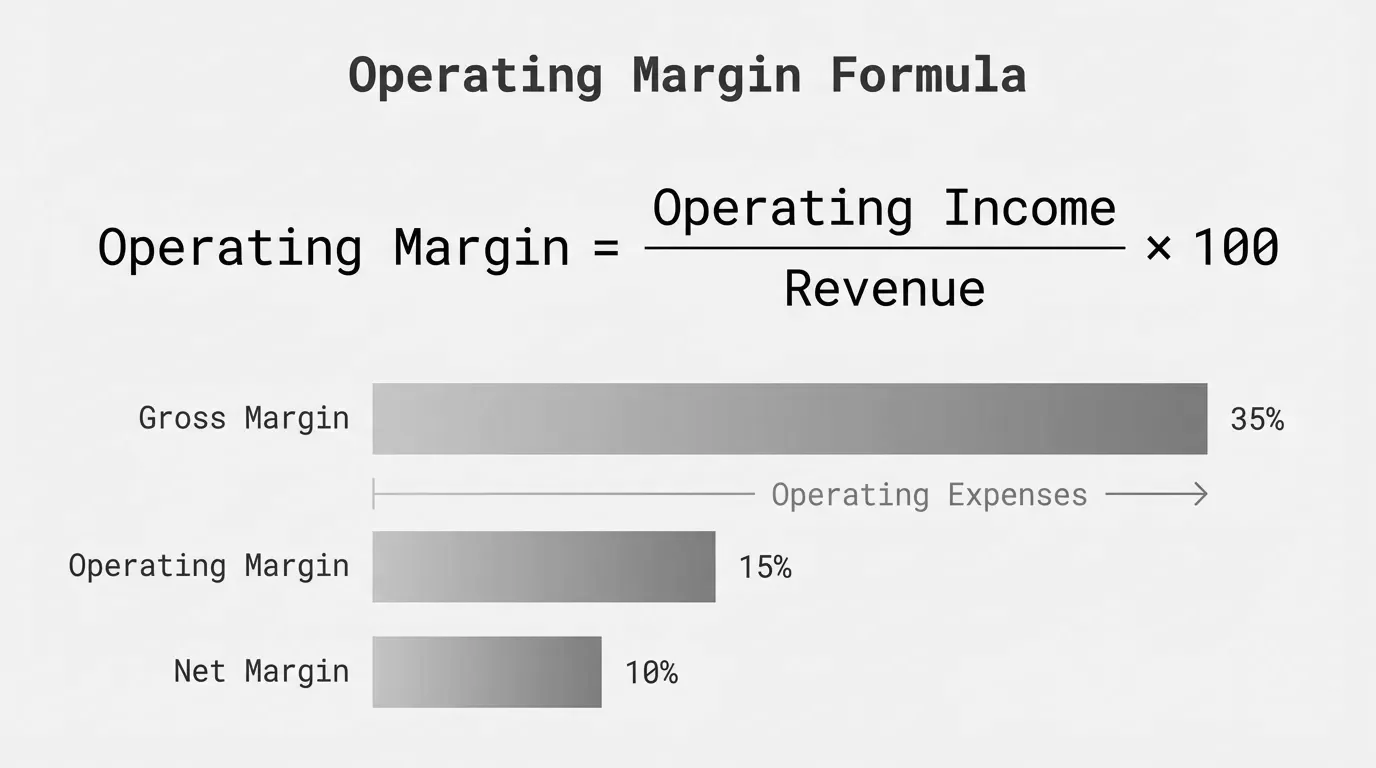
Operating Margin = (Operating Income / Revenue) x 100Or expressed another way:
Operating Margin = ((Revenue - COGS - Operating Expenses) / Revenue) x 100A 15% operating margin means you keep $0.15 in operating profit for every $1.00 in sales.
How to Calculate Operating Margin Step by Step
The calculation requires three numbers from your income statement:
- Total Revenue (Net Sales)
- Cost of Goods Sold (COGS)
- Operating Expenses (SG&A, rent, utilities, depreciation)
Here's the process:
Step 1: Calculate gross profit
Gross Profit = Revenue - COGSStep 2: Calculate operating income
Operating Income = Gross Profit - Operating ExpensesStep 3: Calculate operating margin
Operating Margin = (Operating Income / Revenue) x 100Worked Example: Distribution Company
Midwest Industrial Supply, a $45M distributor, has these annual figures:
- Revenue: $45,000,000
- COGS: $31,500,000
- Operating expenses: $9,450,000
Calculate gross profit:
$45,000,000 - $31,500,000 = $13,500,000Calculate operating income:
$13,500,000 - $9,450,000 = $4,050,000Calculate operating margin:
($4,050,000 / $45,000,000) x 100 = 9.0%Midwest Industrial operates at a 9% operating margin. For distribution, this falls slightly below the 10-15% typical range, signaling room for improvement.
What Counts as Operating Expenses
Operating expenses include costs to run the business that are not tied directly to producing goods:
- Salaries and wages (non-production staff)
- Rent and facilities
- Utilities
- Insurance
- Marketing and advertising
- Office supplies
- Depreciation and amortization
- Professional services (accounting, legal)
Operating expenses specifically exclude interest payments and income taxes. These are accounted for after operating income, which is why operating margin is sometimes called "EBIT margin" (Earnings Before Interest and Taxes).
Operating Margin vs Gross Margin vs Net Margin
These three margin metrics each tell you something different about profitability.
| Margin Type | What It Measures | Costs Deducted |
|---|---|---|
| Gross Margin | Production efficiency | COGS only |
| Operating Margin | Operational efficiency | COGS + Operating expenses |
| Net Margin | Total profitability | All costs including interest and taxes |
Gross margin shows whether your pricing covers direct costs. A distributor buying widgets at $7 and selling at $10 has a 30% gross margin.
Operating margin adds overhead. That same distributor paying warehouse staff, rent, and utilities might see operating margin drop to 12%.
Net margin includes financing costs and taxes. After interest on inventory financing and corporate taxes, net margin might land at 6%.
For a complete breakdown of how these metrics work together, see our margin analysis guide.
Operating Margin Benchmarks by Industry
Operating margins vary widely across sectors. Capital-intensive industries with high overhead run thinner margins than service businesses.
| Industry | Typical Operating Margin |
|---|---|
| Software/SaaS | 20-30% |
| Pharmaceuticals | 15-25% |
| Industrial Manufacturing | 10-15% |
| Wholesale Distribution | 3-8% |
| Food Distribution | 2-4% |
| Grocery Retail | 2-5% |
| Auto Manufacturing | 5-10% |
For distribution and manufacturing companies in the $20M-$200M range, operating margins typically fall between 5% and 15%. Companies at the higher end usually have:
- Strong supplier relationships and volume discounts
- Efficient warehouse operations
- Low customer concentration risk
- Disciplined pricing strategies
Five Factors That Drive Operating Margin
1. Pricing Power
Your ability to raise prices without losing customers directly impacts operating margin. A 2% price increase on a business with 30% gross margin drops straight to the bottom line, potentially adding 2 percentage points to operating margin.
2. COGS Management
Supplier negotiations, purchase timing, and inventory management all affect the cost of goods sold. Distribution companies often leave money on the table through inconsistent purchasing practices.
3. Labor Efficiency
Wages typically represent the largest operating expense. Revenue per employee serves as a useful proxy metric. A $50M distributor with 100 employees generates $500K per head. Improving to $550K per employee through automation or process improvement directly boosts operating margin.
4. Fixed Cost Leverage
Fixed costs (rent, insurance, depreciation) stay constant regardless of sales volume. Growing revenue against a fixed cost base improves operating margin. Shrinking revenue has the opposite effect.
5. Variable Cost Control
Shipping, commissions, and utilities fluctuate with activity levels. Monitoring cost-per-unit metrics helps identify when variable costs creep higher than they should.
How to Improve Operating Margin
Distributors and manufacturers typically find margin improvement opportunities in three areas:
Pricing discipline - Scattered discounting erodes margin across thousands of transactions. Even small price leaks on high-volume SKUs compound into significant losses. Analyzing actual transaction prices against list prices often reveals 2-5% of revenue leaking through inconsistent discounting.
Operational efficiency - Warehouse labor, logistics routing, and inventory carrying costs all present optimization opportunities. The goal is doing more with less without sacrificing service quality.
Mix management - Not all products contribute equally to operating profit. Shifting sales mix toward higher-margin products and away from low-margin lines improves overall operating margin without changing prices.
Operating Margin Formula: Quick Reference
Operating Margin = (Operating Income / Revenue) x 100Where:
Operating Income = Revenue - COGS - Operating ExpensesRemember:
- Operating income excludes interest and taxes
- Operating expenses include SG&A, rent, depreciation
- COGS includes only direct production/purchase costs
Track operating margin quarterly at minimum. Month-over-month fluctuations are normal, but a declining trend over multiple quarters signals problems that need attention before they compound.
Last updated: January 6, 2026
Frequently Asked Questions

Want to analyze your entire product catalog?
Pryse automatically identifies margin leakage across thousands of SKUs. Upload your data and find hidden profit in 24 hours.
One-time $1,499 diagnostic. No subscription required.