What Is a Good Gross Margin? Industry Benchmarks and How to Evaluate Yours
A good gross margin ranges from 15% to 50% depending on your industry. See benchmarks for distribution and manufacturing, plus how to evaluate your margin.
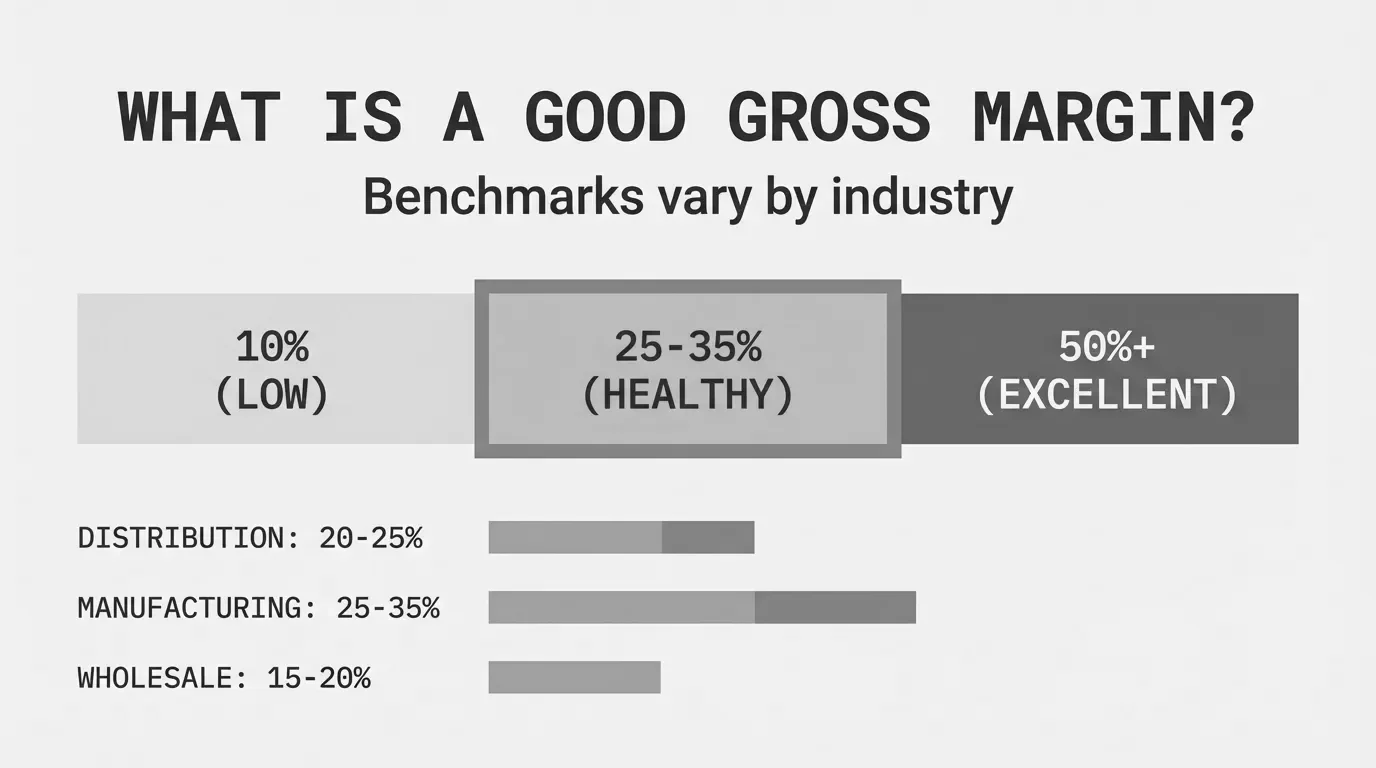
A good gross margin depends entirely on your industry. For wholesale distribution, 20% to 30% is healthy. For manufacturing, 25% to 40% is typical. For software, anything below 70% raises questions.
The question isn't whether your margin is "good" in absolute terms. The question is whether it's good for your industry, your business model, and your growth stage.
Gross Margin Benchmarks by Industry
Gross margin varies dramatically across industries. A 25% margin that's excellent for a food distributor would be disastrous for a software company. Here's what the data shows:
| Industry | Typical Gross Margin | Source |
|---|---|---|
| SaaS / Software | 70% - 85% | Industry reports |
| Professional Services | 50% - 70% | Industry average |
| Specialty Manufacturing | 35% - 50% | NYU Stern data |
| Machinery Manufacturing | 35% - 40% | NYU Stern (37.47%) |
| Electrical Equipment | 30% - 35% | NYU Stern (31.82%) |
| Building Materials | 28% - 33% | NYU Stern (30.94%) |
| General Manufacturing | 25% - 35% | Industry average |
| Electronics Distribution | 25% - 30% | NYU Stern (26.76%) |
| Packaging & Containers | 22% - 27% | NYU Stern (24.27%) |
| Wholesale Distribution | 20% - 30% | Industry average |
| Auto Parts | 14% - 18% | NYU Stern (15.84%) |
| Food Wholesalers | 13% - 18% | NYU Stern (15.44%) |
Data from NYU Stern's industry margin database, updated January 2026.
The average gross margin across all industries sits around 36%, according to Vena Solutions industry benchmarking. But this number is skewed by high-margin sectors like software and pharmaceuticals. For product-based businesses moving physical goods, 20-35% is the realistic range.
What's "Good" for Distribution Companies
Distribution operates on thinner margins than most industries. You're buying products and reselling them, not creating proprietary value. That's the nature of the business.
Healthy gross margins for distributors:
- Food/grocery distribution: 13-18%
- Industrial distribution: 22-30%
- Electrical distribution: 25-32%
- Specialty/technical distribution: 28-38%
According to McKinsey's industrial distribution research, the top-performing distributors ("legends" in their analysis) maintained an average 30% ROIC while expanding gross margins slightly over a decade. They achieved this through pricing discipline and operational efficiency, not by being in higher-margin product categories.
For mid-market distributors in the $20M-$200M range, here's how to interpret your gross margin:
| Your Gross Margin | What It Means |
|---|---|
| Below 15% | Likely pricing problems or commodity trap |
| 15-20% | Acceptable for high-volume, low-touch distribution |
| 20-25% | Healthy for general distribution |
| 25-30% | Strong; indicates pricing power or value-add services |
| Above 30% | Excellent; usually requires specialization or proprietary products |
What's "Good" for Manufacturing Companies
Manufacturers have more margin variability than distributors because they create products. Your margin depends on:
- Product complexity: Simple commodity products vs. engineered solutions
- Market position: Price leader vs. differentiated provider
- Scale: Fixed costs spread across volume
- Vertical integration: Making vs. buying components
Healthy gross margins for manufacturers:
- Commodity manufacturing: 20-28%
- General manufacturing: 25-35%
- Industrial machinery: 32-40%
- Specialty/custom manufacturing: 35-50%
A $75M industrial manufacturer operating at 28% gross margin is performing reasonably well. The same margin at a specialty chemical manufacturer would signal problems.
| Your Gross Margin | What It Means |
|---|---|
| Below 20% | Commodity pricing pressure or cost structure issues |
| 20-28% | Acceptable for volume manufacturing |
| 28-35% | Healthy for most manufacturing |
| 35-45% | Strong; indicates differentiation or niche market |
| Above 45% | Excellent; usually requires proprietary technology |
Factors That Shift What's "Good" for Your Business
Industry benchmarks are starting points, not targets. Several factors push your "good" margin higher or lower:
Business Model Factors
Value-added services raise your margin ceiling. A distributor providing technical support, custom kitting, or inventory management should command higher margins than one just moving boxes. If you're at 22% gross margin while offering significant value-adds, you're likely underpriced.
Private label or proprietary products push margins up. Distributing someone else's branded product means competing on price. Manufacturing your own means capturing more value.
Customer concentration matters. If 40% of revenue comes from three accounts who negotiated hard, your overall margin doesn't reflect your true pricing capability. Look at margin distribution, not just the average.
Market Position Factors
Specialization commands premium margins. A general fastener distributor might hit 20%. A specialty fastener distributor serving aerospace? 32%.
Geographic monopolies or oligopolies change the math. Limited competition in a region allows margin expansion beyond industry benchmarks.
Switching costs protect margins. If customers face real pain to switch suppliers (integration, training, qualification), you have more pricing power.
Operational Factors
Scale compresses your "good" target. High-volume, low-touch operations can be profitable at 18% gross margin. Low-volume, high-touch operations need 30%+ to cover costs.
Inventory turns interact with margin. A distributor turning inventory 8x annually at 20% margin generates better returns than one turning 3x at 25%. Margin alone doesn't tell the profitability story.
Warning Signs Your Margin Is Too Low
A below-benchmark gross margin usually points to specific problems:
1. Discounting without tracking. Sales reps give away margin to close deals. Those discounts never get aggregated or analyzed. You think you're at 26% margin; you're actually at 21%.
2. Supplier cost increases not passed through. Your costs went up 4% last year. Customer prices went up 2%. That's 2 points of margin erosion that compounds annually.
3. Product mix drift. You're selling more low-margin items over time, either because sales pushes them or because customers demand them. Overall margin declines while no individual transaction looks bad.
4. Customer-specific pricing that outlived its purpose. A deal negotiated in 2019 for a major account is still active, even though their volume dropped 60%. Pricing rarely gets revisited.
5. Hidden cost absorption. You're eating freight, handling, restocking, and expedite costs that should be charged. These don't show up in COGS, so your gross margin looks fine while your actual margin erodes.
For a deeper look at finding these issues, see our complete guide to margin analysis.
Warning Signs Your Margin Is Too High
High margins aren't always good news:
1. You're leaving growth on the table. Margins above industry benchmark might mean you're pricing yourself out of market share you could profitably capture.
2. You're vulnerable to competition. Abnormally high margins attract competitors. If a new entrant can serve your customers at 25% margin when you're at 38%, you'll feel it.
3. Customer satisfaction risk. Customers who feel overcharged eventually leave or demand renegotiation. High margins today can become retention problems tomorrow.
4. You're not investing in growth. Some companies maintain high margins by underinvesting in sales, marketing, and product development. The margin looks great until growth stalls.
That said, if you're genuinely differentiated with sticky customers and a defensible niche, high margins are appropriate. The warning applies when high margins come from neglect rather than value creation.
How to Compare Your Margin to Benchmarks
A single gross margin number doesn't tell you much. Here's how to make the comparison meaningful:
1. Calculate Margin the Same Way
Make sure you're including the same costs in COGS that benchmarks use:
Gross Margin = (Revenue - COGS) / Revenue x 100COGS should include direct product costs, inbound freight, and direct labor for manufacturing. It shouldn't include warehouse labor for outbound shipping, sales costs, or general overhead.
If your ERP calculates margin differently, adjust before comparing to industry data.
2. Segment Your Analysis
Company-wide margin hides what's happening underneath. Calculate margin by:
- Product category: Which categories drag down the average?
- Customer segment: Are your biggest customers your most profitable?
- Sales channel: Does e-commerce have different margin than direct sales?
- Time period: Is margin trending up, down, or flat?
A 24% overall margin might be masking 35% margin on specialty products and 15% margin on commodity items. The insight is in the segmentation.
3. Factor in Your Cost Structure
Margin benchmarks assume average cost structures. If your fixed costs are higher (more locations, larger sales team, more technology investment), you need higher margins to achieve the same profitability.
A distributor at 28% gross margin with 24% SG&A has 4% operating margin. One at 22% gross margin with 14% SG&A has 8% operating margin. The "lower" margin company is more profitable.
4. Track Margin Trend, Not Just Level
A gross margin that's declined from 28% to 24% over three years is more concerning than a stable 22%. Trend direction matters as much as absolute level.
If margin is declining, find out why before benchmarking. You might be solving the wrong problem.
The Real Question: Where Is Your Margin Going?
Knowing whether your gross margin is "good" is useful context. But the more actionable question is: where is margin leaking?
Most distribution and manufacturing companies have 3-7 percentage points of recoverable margin hiding in their transaction data. It's in:
- Discounts that were supposed to be one-time but became permanent
- Freight and handling charges that never got billed
- Customer-specific pricing that hasn't been reviewed in years
- Cost increases that weren't fully passed through
Finding this margin requires analyzing transactions at the line-item level across products, customers, and time periods. Excel can do this for small datasets. For companies with thousands of SKUs and hundreds of customers, it becomes a project.
That's what Pryse is built for. Upload your transaction data and see where your margin actually goes in 24 hours, not 6 months.
Last updated: January 15, 2026
Frequently Asked Questions

Want to analyze your entire product catalog?
Pryse automatically identifies margin leakage across thousands of SKUs. Upload your data and find hidden profit in 24 hours.
One-time $1,499 diagnostic. No subscription required.