Gross Margin vs Net Margin: What Each Metric Tells You About Profitability
Gross margin measures production efficiency while net margin shows bottom-line profit. Learn when to use each metric and how they work together.
Gross margin measures what you keep after paying for the product itself. Net margin measures what you keep after paying for everything.
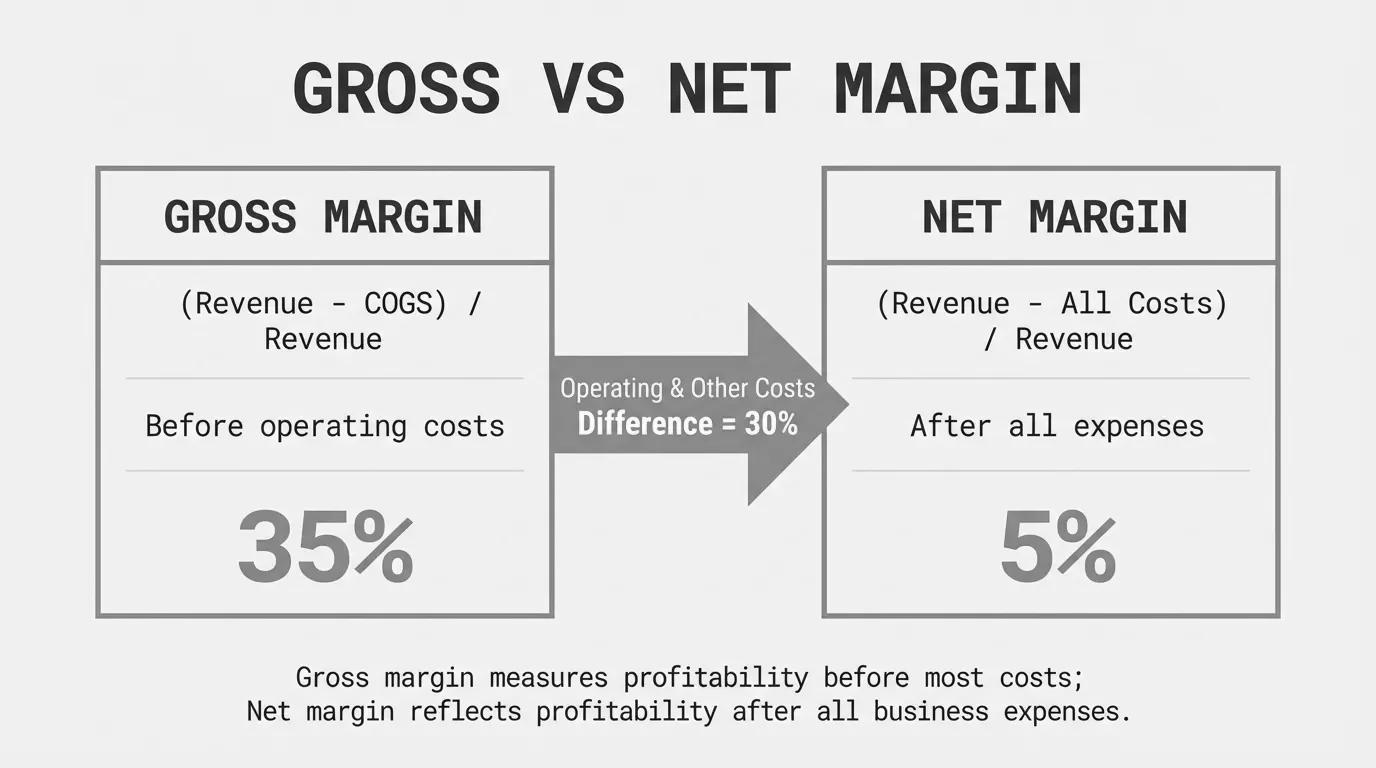
Gross Margin = (Revenue - Cost of Goods Sold) / Revenue x 100Net Margin = (Revenue - All Expenses) / Revenue x 100A distributor with 25% gross margin and 4% net margin keeps $0.25 of every dollar after product costs, but only $0.04 after running the entire business. The 21-point gap between them represents operating expenses, interest, and taxes.
Both metrics matter. Gross margin tells you if your pricing and sourcing are working. Net margin tells you if the whole business is working.
The Core Difference: What Gets Subtracted
The distinction comes down to which costs you subtract from revenue.
Gross margin subtracts only direct costs:
- Cost of goods sold (COGS)
- Raw materials and components
- Direct labor for production
- Manufacturing overhead
- Inbound freight
Net margin subtracts everything:
- Cost of goods sold
- Operating expenses (salaries, rent, utilities, marketing)
- Interest on debt
- Income taxes
- Other expenses and deductions
This is why net margin is always lower than gross margin. You're subtracting additional cost categories.
Side-by-Side Comparison
| Aspect | Gross Margin | Net Margin |
|---|---|---|
| Formula | (Revenue - COGS) / Revenue | Net Profit / Revenue |
| What it measures | Production/sourcing efficiency | Overall profitability |
| Costs included | Direct costs only | All costs |
| Typical range (distribution) | 20-30% | 2-10% |
| Typical range (manufacturing) | 25-35% | 5-10% |
| Best use case | Product pricing, supplier negotiation | Business valuation, investor reporting |
| Where to find it | Income statement, first section | Income statement, bottom line |
| Who cares most | Operations, purchasing, product managers | CFO, investors, owners |
The Formulas Explained
Gross Margin Formula
Gross Margin = (Revenue - Cost of Goods Sold) / Revenue x 100Or expressed another way:
Gross Margin = Gross Profit / Revenue x 100Gross profit is the dollar amount. Gross margin is the percentage. A company with $10M revenue and $7M COGS has $3M gross profit and 30% gross margin.
Net Margin Formula
Net Margin = Net Profit / Revenue x 100Expanded:
Net Margin = (Revenue - COGS - Operating Expenses - Interest - Taxes) / Revenue x 100Net profit is what remains after every expense. It's the bottom line number that determines what owners actually keep.
Real Example: Same Company, Both Calculations
A mid-market industrial parts distributor reports these annual numbers:
| Line Item | Amount |
|---|---|
| Revenue | $35,000,000 |
| Cost of Goods Sold | $25,900,000 |
| Gross Profit | $9,100,000 |
| Operating Expenses | $7,000,000 |
| Operating Income | $2,100,000 |
| Interest Expense | $350,000 |
| Taxes | $420,000 |
| Net Profit | $1,330,000 |
Gross Margin Calculation:
Gross Margin = $9,100,000 / $35,000,000 x 100 = 26%This distributor keeps $0.26 of every revenue dollar after paying for inventory.
Net Margin Calculation:
Net Margin = $1,330,000 / $35,000,000 x 100 = 3.8%After all expenses, only $0.038 of each dollar reaches the bottom line.
The gap analysis: This company loses 22.2 percentage points between gross and net margin. Where does it go?
| Category | Amount | % of Revenue |
|---|---|---|
| Operating expenses | $7,000,000 | 20.0% |
| Interest | $350,000 | 1.0% |
| Taxes | $420,000 | 1.2% |
| Total margin erosion | $7,770,000 | 22.2% |
Operating expenses consume most of the gross profit. This company has an overhead problem, not a pricing problem.
When to Use Which Metric
Use Gross Margin When:
Evaluating product pricing. If a product has 15% gross margin when your target is 25%, the price is too low or the cost is too high. Gross margin isolates this question from overhead allocation debates.
Comparing products or categories. Gross margin lets you rank products by profitability without allocating shared costs. Your fastener line at 32% gross margin performs better than fittings at 19%.
Negotiating with suppliers. Gross margin shows direct impact of cost changes. A 5% cost increase on a 25% gross margin product drops margin to 21.25%. That's concrete information for negotiation.
Analyzing pricing trends. Year-over-year gross margin decline indicates pricing problems or cost creep. Operating costs don't cloud the signal.
Benchmarking operational efficiency. Industry gross margin benchmarks let you compare your production or sourcing against competitors.
Use Net Margin When:
Assessing overall business health. Net margin is the true profitability metric. A company can have stellar gross margins and still lose money if overhead is excessive.
Valuing the business. Buyers and investors care about net income. A company worth 5x earnings with $1.5M net profit is valued at $7.5M. Gross profit doesn't enter that calculation.
Making capital allocation decisions. Should you reinvest in growth or distribute profits? Net margin determines how much is available for either option.
Comparing to external benchmarks. Public company data, industry reports, and investor expectations reference net margin. It's the universal profitability language.
Planning for taxes and debt. Interest and taxes affect net margin, not gross. Financial planning requires the complete picture.
Industry Benchmarks: What to Expect
Gross Margin Benchmarks
| Industry | Low | Typical | Strong |
|---|---|---|---|
| Wholesale Distribution | 15% | 22-28% | 32%+ |
| Industrial Manufacturing | 20% | 28-35% | 40%+ |
| Food Distribution | 10% | 15-22% | 28%+ |
| Building Materials | 18% | 24-30% | 35%+ |
| Electrical Equipment | 25% | 32-40% | 45%+ |
Net Margin Benchmarks
| Industry | Low | Typical | Strong |
|---|---|---|---|
| Wholesale Distribution | 1% | 3-6% | 10%+ |
| Industrial Manufacturing | 3% | 6-10% | 14%+ |
| Food Distribution | 0.5% | 1.5-3% | 5%+ |
| Building Materials | 2% | 4-7% | 10%+ |
| Electrical Equipment | 4% | 7-12% | 15%+ |
Distribution runs thinner margins than manufacturing because distributors add less value in the transformation process. A 25% gross margin distributor and a 25% gross margin manufacturer are performing very differently relative to their industries.
The Margin Gap: What It Reveals
The difference between gross margin and net margin tells a story about your cost structure.
Small gap (8-12 points): Lean operations. Fixed costs are well-controlled relative to revenue. Typical for high-volume, efficient businesses.
Medium gap (15-20 points): Normal for mid-market companies with standard overhead levels. Room for improvement but not alarming.
Large gap (25+ points): Heavy overhead burden. Either the business needs more revenue to cover fixed costs, or expenses need cutting. Common for companies growing into infrastructure they haven't filled yet.
Example comparison:
| Company | Gross Margin | Net Margin | Gap |
|---|---|---|---|
| Distributor A | 24% | 6% | 18 pts |
| Distributor B | 28% | 3% | 25 pts |
Distributor A has lower gross margin but higher net margin. They run a tighter operation. Distributor B captures more on each sale but gives it back in overhead.
If you're trying to improve profitability, the gap shows where to focus. A company with 30% gross margin and 4% net margin won't fix things by raising prices. They need to address the 26 points disappearing to expenses.
Common Misconceptions
"High gross margin means the business is profitable"
Not necessarily. A company can have 40% gross margin and lose money if operating costs exceed gross profit. Gross margin is a prerequisite for profitability, not a guarantee.
"Net margin is the only metric that matters"
Net margin doesn't help you price products or evaluate suppliers. It blends too many factors. A declining net margin might come from pricing problems, cost increases, overhead growth, or higher interest rates. Gross margin isolates the product economics.
"These margins should be similar"
They measure different things and should differ. If your gross margin is 28% and net margin is 26%, something is unusual. Either operating costs are extraordinarily low or the numbers are wrong.
"Industry benchmarks apply uniformly"
A commodity distributor and a specialty distributor have different margin expectations. A job shop manufacturer and a high-volume producer operate in different ranges. Compare to companies with similar business models, not just the same SIC code.
How They Work Together in Margin Analysis
Smart margin analysis uses both metrics in sequence.
Step 1: Check gross margin health. Is your gross margin in line with industry benchmarks? If it's below target, focus on pricing and cost of goods. Nothing else matters until gross margin is acceptable.
Step 2: Calculate the gap. Subtract net margin from gross margin. This is your overhead burden. A 22-point gap on $40M revenue means $8.8M in non-COGS expenses.
Step 3: Break down the gap. What portion goes to operating expenses? Interest? Taxes? This tells you where margin disappears.
Step 4: Identify actionable items. Pricing and sourcing improve gross margin. Operational efficiency improves the gap. Tax planning and debt reduction improve net margin specifically.
Step 5: Track trends. Both margins should be stable or improving over time. Gross margin decline signals pricing or cost problems. Net margin decline with stable gross margin signals overhead growth.
For a complete framework on analyzing these metrics together, see our guide to margin analysis.
Improving Each Metric
To Improve Gross Margin
Raise prices where you have leverage. Not all customers are equally price-sensitive. Segment your base and adjust where resistance is low.
Negotiate supplier costs. Consolidate purchasing, compete bids annually, and capture all earned rebates.
Fix pricing inconsistency. Many companies have the same product at different prices across customers without justification. Standardizing prices can add 1-3 percentage points.
Shift product mix. Push sales toward higher-margin products through incentives, training, and marketing focus.
Reduce COGS leakage. Freight costs, damage, returns, and obsolescence all affect cost of goods. Track and reduce them.
To Improve Net Margin
Address the biggest overhead categories. Labor and facilities typically dominate operating expenses. Efficiency gains here have the largest impact.
Increase volume without proportional overhead. Fixed costs spread across more revenue improve net margin. This is operating leverage.
Reduce debt costs. Refinance high-interest loans. Pay down balances with excess cash. Interest savings flow directly to net margin.
Optimize tax position. Work with advisors on available credits, deductions, and structure. Tax efficiency improves net margin without operational changes.
Cut non-essential spending. Subscriptions, services, and discretionary expenses accumulate. Review and eliminate what doesn't earn its keep.
The Bottom Line
Gross margin and net margin answer different questions. Gross margin asks: are we making money on each sale? Net margin asks: are we making money overall?
For distribution and manufacturing companies, both metrics need attention. Strong gross margins fund the business. Strong net margins reward owners and investors.
If gross margin is below industry benchmarks, pricing and sourcing need work. If the gap between gross and net is too wide, overhead needs cutting. If net margin is healthy but gross margin is thin, you're running efficiently but pricing below potential.
Most mid-market companies have opportunities in both areas. Running a price waterfall analysis reveals where gross margin leaks. Operating cost analysis shows where the gap grows wider than necessary.
A 1% improvement in gross margin drops straight to net margin if costs stay flat. On $50M revenue, that's $500,000 annually. Understanding both metrics and how they connect is where the margin improvement starts.
Last updated: January 9, 2026
Frequently Asked Questions

Want to analyze your entire product catalog?
Pryse automatically identifies margin leakage across thousands of SKUs. Upload your data and find hidden profit in 24 hours.
One-time $1,499 diagnostic. No subscription required.