Gross Margin Analysis: What It Is and How to Calculate It
Learn gross margin analysis with formulas, benchmarks, and examples for distribution and manufacturing companies.
Gross margin is the percentage of revenue remaining after subtracting the direct cost of goods sold. For a $50M distributor, a 2-point improvement in gross margin represents $1M in additional profit before operating expenses.
Most mid-market distribution and manufacturing companies track gross margin in Excel, pulling numbers from ERP reports monthly or quarterly. The challenge is not the calculation itself. It is identifying where margin varies across customers, products, and transactions, and finding the specific line items causing erosion.
What Is Gross Margin?
Gross margin measures the profitability of your core business before operating expenses. It answers a fundamental question: how much money do you keep from each dollar of revenue after paying for the products or materials you sell?
The calculation is straightforward:
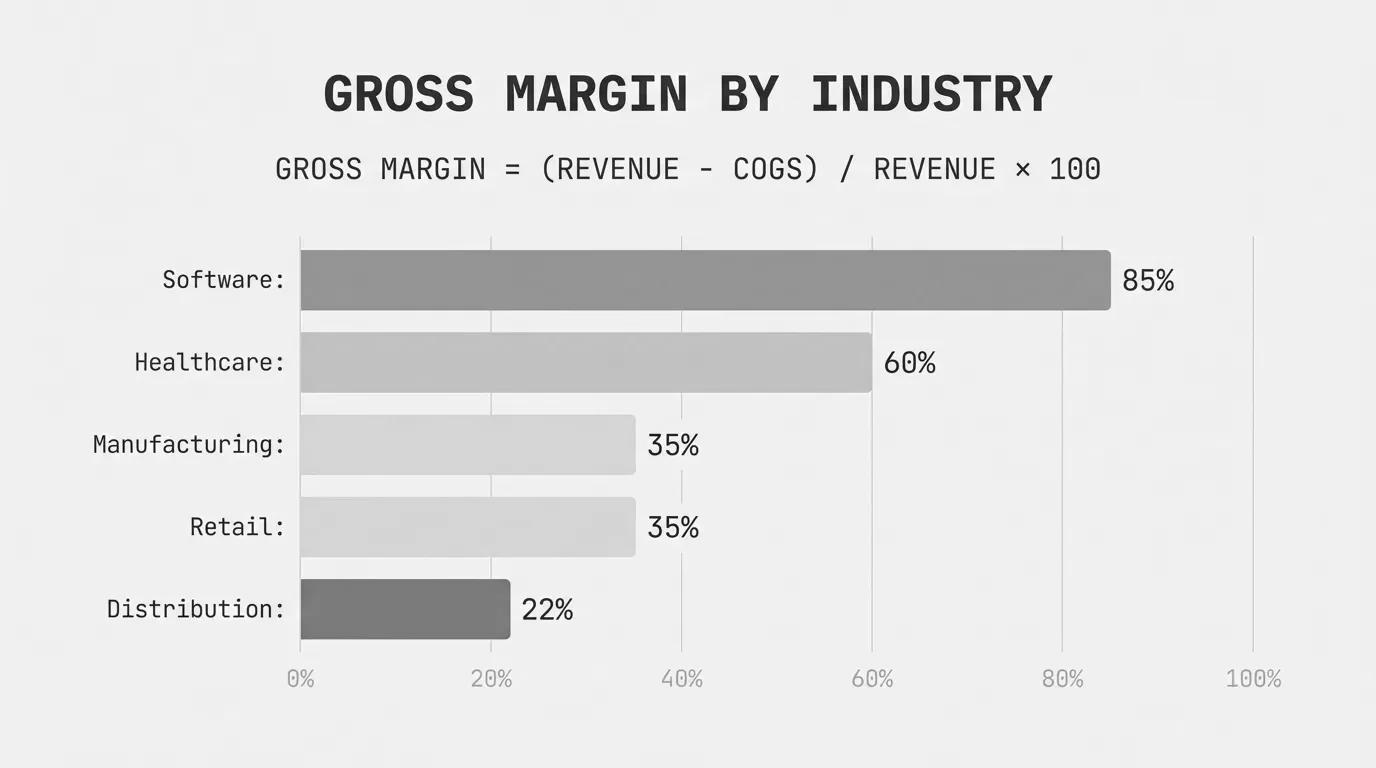
(Revenue - Cost of Goods Sold) / Revenue x 100 = Gross Margin %If your company generates $10 million in revenue and your cost of goods sold totals $7 million, your gross margin is 30%.
($10,000,000 - $7,000,000) / $10,000,000 x 100 = 30%This 30% represents the portion of each revenue dollar available to cover operating expenses, pay salaries, invest in growth, and generate profit.
Gross Margin vs. Gross Profit
These terms get used interchangeably, but they measure different things. Gross profit is a dollar amount. Gross margin is a percentage.
| Metric | Formula | Example ($1M Revenue, $650K COGS) |
|---|---|---|
| Gross Profit | Revenue - COGS | $350,000 |
| Gross Margin | (Revenue - COGS) / Revenue x 100 | 35% |
Both metrics come from the same inputs. The difference matters when you compare performance across time periods, business units, or competitors.
A $75M distributor with $15M gross profit sounds more profitable than a $30M distributor with $9M gross profit. But expressed as margin, the smaller company at 30% outperforms the larger one at 20%. The percentage normalizes for scale, letting you benchmark against companies of different sizes.
If you are pulling numbers from your ERP into Excel, gross profit is usually what you see first. Converting to margin percentage takes one extra column but makes the data far more actionable for analysis.
How to Calculate Gross Margin Step by Step
Step 1: Determine Total Revenue
Revenue is the total amount billed to customers before any deductions. For distributors, this is typically the sum of all invoice line items. For manufacturers, it is the value of goods shipped.
Use net revenue if your ERP tracks it separately. Net revenue subtracts returns and allowances from gross revenue, giving you a cleaner starting point.
Step 2: Calculate Cost of Goods Sold
COGS includes the direct costs required to produce or acquire the products you sell:
For distributors:
- Purchase cost of inventory from suppliers
- Inbound freight to your warehouse
- Import duties and tariffs
For manufacturers:
- Raw materials and components
- Direct labor (production floor workers)
- Manufacturing overhead (factory utilities, equipment depreciation)
COGS does not include:
- Sales and marketing expenses
- Administrative salaries
- Outbound shipping to customers
- Rent for office space (separate from production facilities)
Step 3: Apply the Formula
Gross Profit = Revenue - COGS
Gross Margin = (Gross Profit / Revenue) x 100
Example calculation:
A building materials distributor has the following annual figures:
- Revenue: $42,000,000
- Cost of goods sold: $30,240,000
Gross Profit = $42,000,000 - $30,240,000 = $11,760,000
Gross Margin = ($11,760,000 / $42,000,000) x 100 = 28%
This 28% gross margin falls within the typical range for building materials distribution. The company retains $0.28 from every dollar of revenue to cover operating costs and profit.
Gross Margin Benchmarks by Industry
Gross margins vary significantly by industry. Comparing your performance against the wrong benchmark leads to bad conclusions. A 25% gross margin is excellent for a food wholesaler but would signal problems for a specialty manufacturer.
Distribution and Wholesale Benchmarks
| Industry Segment | Typical Gross Margin |
|---|---|
| Food wholesalers | 15-18% |
| Industrial distribution | 22-28% |
| Electrical distribution | 25-32% |
| Building materials | 28-35% |
| Specialty distribution | 30-40% |
According to data from NYU Stern, food wholesalers average around 15.44% gross margin, while broader retail distribution averages 30.57%. The spread reflects differences in product complexity, value-added services, and competitive intensity.
Wholesale businesses generally operate on gross margins between 20% and 30%, with Entrepreneur magazine citing 25% as a typical figure for wholesale distributors.
Manufacturing Benchmarks
| Industry Segment | Typical Gross Margin |
|---|---|
| Auto parts manufacturing | 15-18% |
| General electronics | 25-30% |
| Electrical equipment | 30-35% |
| Industrial machinery | 35-40% |
| Specialty/precision manufacturing | 40-50% |
Manufacturing margins depend heavily on product complexity and automation levels. Auto parts and commodity manufacturing operate on thin margins around 15-18%. Specialized industrial machinery manufacturers can achieve margins above 37% according to recent industry data.
The average manufacturing company spends approximately 42% of revenue on material costs alone. Companies in this range should focus on supplier negotiations and production efficiency to protect margins.
Why Benchmarks Only Tell Part of the Story
Industry averages mask significant variation within companies. When we analyze transaction-level data from distributors, we typically see gross margin ranges of 20 percentage points or more across their customer base.
One electrical distributor we worked with had an overall gross margin of 26%. Customer-level analysis revealed margins ranging from 15% to 38%. The company was losing money on three of their top 20 accounts while significantly overpricing smaller customers who had less negotiating power.
Benchmark data tells you whether you are in the right ballpark. Transaction analysis tells you where margin is actually leaking.
Common Causes of Gross Margin Erosion
Gross margin rarely erodes all at once. It leaks through small concessions that accumulate over time.
Discount Stacking
Sales reps apply multiple discounts to the same order: a promotional discount, a volume discount, and a relationship discount. Each discount seems reasonable in isolation. Combined, they push margin below acceptable thresholds.
In Excel, this is hard to catch because discounts often live in different columns or get calculated at different steps in the order process. You see the final invoice price, not the discount path that got there.
Cost Increases Not Passed Through
Supplier costs increase 4% in March. Your price lists do not update until July. For four months, your margin compresses on every sale of affected products.
For companies managing thousands of SKUs, this delay is common. The pricing team does not have visibility into which products had cost increases, or the update process takes too long to execute across all channels and customer agreements.
Legacy Customer Pricing
A major customer negotiated aggressive pricing in 2019 when they represented 8% of your revenue. Today they are 3% of revenue but still receive the same discounts. The original deal made sense. The current situation does not.
These arrangements persist because nobody reviews them. The customer never complains, so the pricing stays in place indefinitely.
Product Mix Shift
Your highest-margin product category grew 5% last year. Your lowest-margin category grew 15%. Overall revenue increased, but gross margin percentage declined because you sold proportionally more low-margin products.
Mix shift is not inherently bad. But if you are not tracking margin by product category, you might miss a meaningful change in business composition until it shows up in annual financials.
How to Analyze Gross Margin Beyond the Total
Company-level gross margin is a lagging indicator. It tells you what happened, not why. Effective gross margin analysis breaks the number down into actionable segments.
By Customer
Export your transaction data and calculate gross margin by customer. Sort by total gross profit contribution, then by margin percentage. You will likely find:
- A handful of large customers with below-average margins
- Smaller customers with premium margins who receive less attention
- Customers with inconsistent margin that varies by product category
This analysis often reveals that margin protection efforts should focus on a small number of accounts responsible for most of the erosion.
By Product Category
Calculate gross margin by product line or category. Compare against your expectations and industry norms. Products with significantly lower margin may indicate:
- Cost increases not reflected in pricing
- Competitive pressure requiring price matching
- Misaligned pricing strategy (using low-margin products as loss leaders without intending to)
By Sales Rep
Sales reps have different discounting behaviors. Some protect margin consistently. Others give away margin to close deals. Analyzing gross margin by rep identifies coaching opportunities and potential incentive misalignment.
This data can be sensitive. Use it to have constructive conversations about pricing strategy, not to punish reps who are following informal guidance to close business at any cost.
By Time Period
Track gross margin monthly or quarterly to spot trends. Compare against the same period in previous years to account for seasonality. Declining gross margin over consecutive periods warrants investigation before it becomes a larger problem.
Improving Gross Margin in Distribution and Manufacturing
Review Pricing on Cost Changes
Establish a process to review and adjust prices when supplier costs change. For high-velocity SKUs, consider automated or semi-automated price updates tied to cost changes. Even a 30-day improvement in the lag between cost increase and price adjustment protects significant margin over a year.
Audit Customer-Specific Pricing
Review customer pricing agreements annually, or when contract terms allow adjustment. Calculate the actual margin realized on each major account and compare against what you expected when the pricing was set.
Customers who have decreased in volume or strategic importance should not retain pricing designed for a different relationship.
Segment Pricing Authority
Not every discount needs approval. But discounts below certain thresholds should. Define margin floors by product category and require review or approval for deals that go below them. This creates natural friction against excessive discounting without slowing down standard transactions.
Track Margin at the Transaction Level
Monthly gross margin reports catch problems after they have accumulated. Transaction-level tracking identifies issues as they happen. If you can see that Tuesday's orders averaged 19% margin instead of your typical 27%, you can investigate immediately.
This granularity requires better data infrastructure than most mid-market companies have in place. The gap between company-level margin tracking and transaction-level visibility represents a significant opportunity for operational improvement.
For a comprehensive framework on margin analysis, including pocket margin and price waterfall analysis, the margin-analysis guide covers the full spectrum from gross margin to realized profitability.
Gross Margin and Your Bottom Line
Gross margin sits at the top of your income statement, but its impact flows through every line below it. A $50M company that improves gross margin from 26% to 28% adds $1M to gross profit. That $1M drops straight to operating income, assuming operating expenses stay flat.
For perspective: to generate the same $1M through revenue growth at a 26% margin, you would need to add $3.85M in new sales. Margin improvement often delivers more bottom-line impact than equivalent revenue growth, with less effort and market risk.
The companies getting the most value from gross margin analysis are not just calculating the number. They are breaking it apart, finding the specific customers and products and transactions where margin deviates from expectations, and taking targeted action.
Your ERP has the data. The question is whether you have the visibility to turn that data into decisions.
Last updated: January 2, 2026
Frequently Asked Questions

Want to analyze your entire product catalog?
Pryse automatically identifies margin leakage across thousands of SKUs. Upload your data and find hidden profit in 24 hours.
One-time $1,499 diagnostic. No subscription required.