Net Profit Margin Formula: How to Calculate Net Margin
The net profit margin formula explained with examples. Learn how to calculate net margin and what a good net margin looks like.
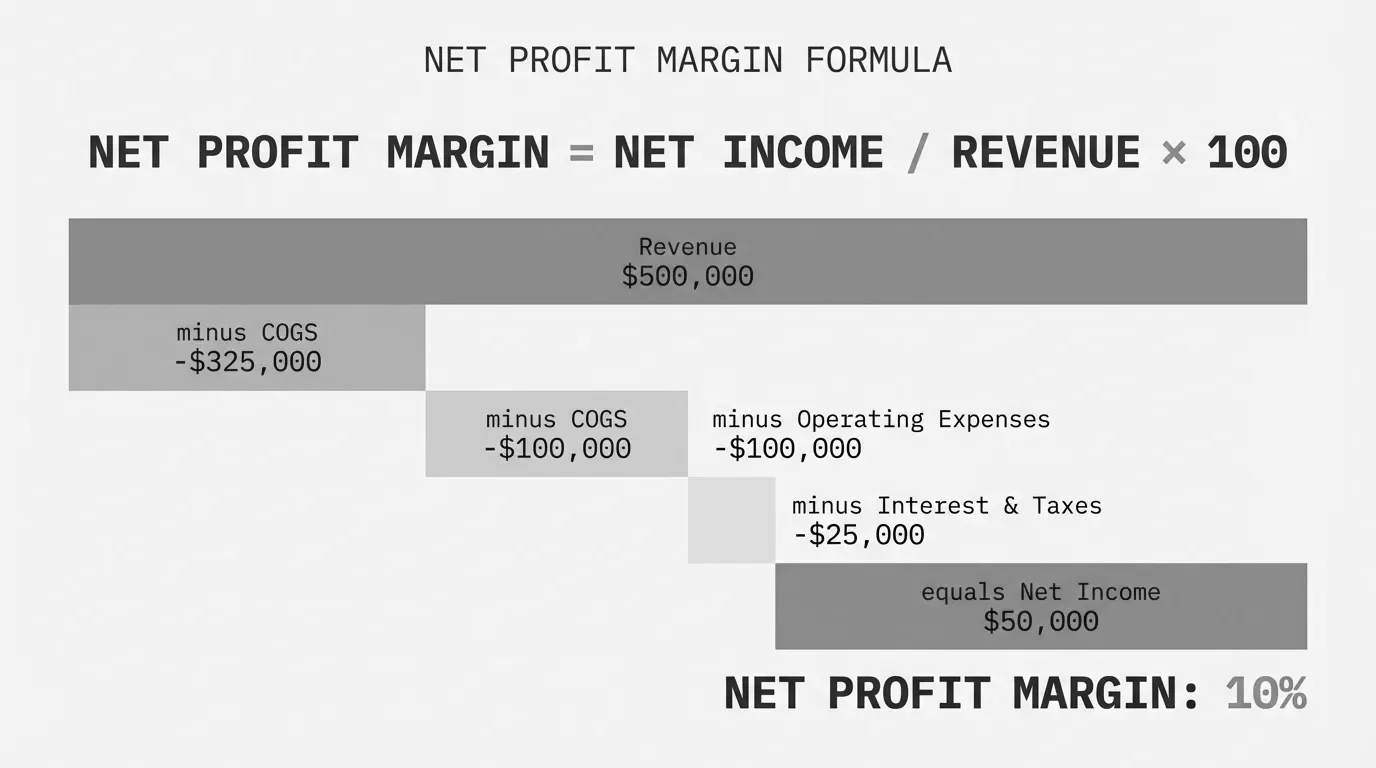
The net profit margin formula tells you what percentage of revenue remains after all expenses are paid.
Net Profit Margin = (Net Profit / Revenue) x 100This is the bottom line profitability metric. Unlike gross margin, which only accounts for direct costs, net margin includes every expense your business incurs.
The Full Net Profit Margin Formula
If you don't have net profit calculated already, here's the expanded version:
Net Profit Margin = ((Revenue - COGS - Operating Expenses - Interest - Taxes) / Revenue) x 100Where:
- Revenue = Total sales before any deductions
- COGS = Cost of goods sold (direct product costs)
- Operating Expenses = Rent, salaries, utilities, marketing, admin costs
- Interest = Loan and debt payments
- Taxes = Income taxes paid
Example Calculation: Distribution Company
A regional distributor has these annual numbers:
| Line Item | Amount |
|---|---|
| Revenue | $45,000,000 |
| Cost of Goods Sold | $33,750,000 |
| Operating Expenses | $8,100,000 |
| Interest Expense | $450,000 |
| Taxes | $540,000 |
Step 1: Calculate net profit
Net Profit = $45,000,000 - $33,750,000 - $8,100,000 - $450,000 - $540,000 = $2,160,000Step 2: Calculate net profit margin
Net Profit Margin = ($2,160,000 / $45,000,000) x 100 = 4.8%This distributor keeps 4.8 cents of every dollar in revenue as profit. That's within the typical 2-10% range for distribution, but there's room to improve.
Example Calculation: Manufacturing Company
A mid-market manufacturer reports:
| Line Item | Amount |
|---|---|
| Revenue | $28,000,000 |
| Cost of Goods Sold | $18,200,000 |
| Operating Expenses | $6,440,000 |
| Interest Expense | $280,000 |
| Taxes | $616,000 |
Step 1: Calculate net profit
Net Profit = $28,000,000 - $18,200,000 - $6,440,000 - $280,000 - $616,000 = $2,464,000Step 2: Calculate net profit margin
Net Profit Margin = ($2,464,000 / $28,000,000) x 100 = 8.8%At 8.8%, this manufacturer is performing at the industry average. The target should be pushing above 10%.
Net Profit Margin Benchmarks by Industry
Net margin varies significantly by sector. Here's what to expect:
| Industry | Typical Net Margin |
|---|---|
| Wholesale Distribution | 2% - 10% |
| Industrial Manufacturing | 5% - 10% |
| Food Distribution | 1% - 3% |
| Building Materials | 3% - 7% |
| Electrical Equipment | 6% - 12% |
| Auto Parts Manufacturing | 3% - 8% |
A 5% margin is considered low but viable. 10% is healthy. Above 20% is exceptional and rare in distribution or manufacturing.
Net Margin vs Gross Margin: The Difference
These two metrics answer different questions:
| Metric | What It Measures | Formula |
|---|---|---|
| Gross Margin | Production efficiency | (Revenue - COGS) / Revenue |
| Net Margin | Overall profitability | (Revenue - All Expenses) / Revenue |
Gross margin shows how efficiently you produce or source products. A distributor buying at $60 and selling at $100 has a 40% gross margin.
Net margin shows what's left after running the entire business. That same distributor might have a 6% net margin after paying for warehouses, trucks, staff, insurance, and debt.
The gap between gross and net margin reveals your operating efficiency. A company with 35% gross margin and 3% net margin has high overhead eating into profits.
What Reduces Net Profit Margin?
Net margin drops when any expense category grows faster than revenue:
Cost of Goods Sold
- Supplier price increases not passed to customers
- Product mix shifting toward lower-margin items
- Volume rebates missed due to purchasing fragmentation
Operating Expenses
- Warehouse and logistics costs rising
- Headcount growing faster than revenue
- Technology and system expenses
Interest and Financing
- High debt loads from acquisitions
- Inventory financing costs
- Equipment loans
Taxes
- State and local tax burdens
- Missed deductions and credits
How to Improve Net Profit Margin
For distribution and manufacturing companies in the $20M-$200M range, these are the highest-impact moves:
1. Fix Pricing Leakage
Most companies have 2-5% of margin leaking through inconsistent pricing. Customer-specific discounts, outdated price lists, and rep discretion add up. Run a price waterfall analysis to find the gaps.
2. Reduce COGS
Consolidate suppliers to hit volume rebate tiers. Negotiate annually, not just at contract renewal. Audit freight costs and landed cost calculations.
3. Cut Operating Waste
Look for duplicate software subscriptions, underutilized warehouse space, and overtime labor. Small fixes compound.
4. Optimize Product Mix
Push sales toward higher-margin SKUs. Consider dropping products where you're losing money after freight and handling.
5. Review Debt Structure
Refinance high-interest debt. Reduce inventory carrying costs with better demand forecasting.
Tracking Net Margin Over Time
Calculate net margin monthly or quarterly. Look for:
- Trend direction: Is margin improving, flat, or declining?
- Seasonality: Do certain quarters always perform worse?
- Variance: What's causing swings from period to period?
A 1% improvement in net margin on $50M revenue puts $500,000 more on the bottom line annually. That's worth tracking closely.
The Bottom Line
The net profit margin formula is straightforward:
Net Profit Margin = (Net Profit / Revenue) x 100For distribution companies, target 5% minimum, 10%+ for healthy operations. For manufacturers, the same benchmarks apply with some variation by sub-industry.
If your net margin is below industry average, start with pricing. It's the fastest lever to pull and often the most overlooked. Most companies we work with find 2-5% in margin recovery just from fixing price inconsistencies across their customer base.
Last updated: January 5, 2026
Frequently Asked Questions

Want to analyze your entire product catalog?
Pryse automatically identifies margin leakage across thousands of SKUs. Upload your data and find hidden profit in 24 hours.
One-time $1,499 diagnostic. No subscription required.