Profitability Analysis Software: A Buyer's Guide for Mid-Market Companies
A practical buyer's guide to profitability analysis software for mid-market distributors and manufacturers. Categories, costs, features, and when Excel is enough.
Profitability analysis software helps you answer a simple question: where do you make money, and where do you lose it? The answer is rarely what you expect.
Most mid-market distributors and manufacturers know their overall gross margin. They know their top-line revenue and rough cost of goods. What they don't know is which specific customers, products, channels, and transactions are actually profitable after you allocate all the costs.
According to Gitnux's 2026 analysis of profitability software, the market spans everything from Excel-adjacent tools to enterprise CPM (Corporate Performance Management) platforms. The challenge for mid-market companies isn't finding software — it's figuring out which category you need and whether you need dedicated software at all.
This guide covers the categories of profitability analysis software, what features matter for mid-market companies, what the tools cost, and when simpler approaches deliver the same insight.
What Profitability Analysis Software Does
Profitability analysis goes beyond basic margin calculation. Margin tells you the percentage difference between revenue and cost. Profitability analysis allocates all costs to determine true profit by customer, product, channel, order, and transaction.
The difference matters. A product with 35% gross margin looks healthy. But if that product requires custom packaging ($2/unit), disproportionate customer service time (returns rate 3x average), and free freight to remote locations ($18/shipment), the actual profit contribution might be 8%. Or negative.
Good profitability analysis software does three things:
Multi-dimensional cost allocation. It spreads costs — freight, warehousing, sales time, customer service, returns processing — across products and customers based on actual usage, not averages. The customer who calls your support team twice a week gets allocated more service cost than the one who orders online without human contact.
Granular reporting. It shows profitability at whatever level you need: by SKU, by customer, by sales rep, by channel, by order size, by geography. The insights live in the intersections — which customers are profitable on which products, which channels work for which categories.
Trend analysis. Profitability changes over time. A customer who was profitable last year might not be this year because costs changed, discounts accumulated, or buying patterns shifted. Software tracks these changes and flags deterioration before it becomes a problem.
The Four Categories of Profitability Analysis Tools
Spreadsheets and BI Tools
What they do: Basic profitability analysis using margin calculations, pivot tables, and standard reporting. Tools like Excel, Google Sheets, Power BI, or Tableau can handle profitability analysis if you build the models yourself.
Cost: Free (Excel) to $10-$70/user/month (BI tools).
Best for: Companies under 5,000 SKUs with straightforward cost structures. If your costs are mostly COGS plus freight, a spreadsheet handles the math. See our margin analysis in Excel guide for specific methods.
Limitations: Manual data refresh, no automated cost allocation, breaks down at scale. You're building the analytical model from scratch every time, which means it's only as good as the analyst maintaining it.
Mid-Market Financial Analysis Platforms
What they do: Purpose-built financial analysis with profitability modules. They connect to your ERP, automate data refresh, and provide structured profitability reporting with drill-down capability.
Examples: Fathom, Spotlight Reporting, Jirav, Datarails.
Cost: $1,000-$5,000/year for basic tiers. $5,000-$20,000 for advanced features.
Best for: Companies that have outgrown Excel but don't need enterprise CPM. These tools work well for overall business profitability analysis — segment-level, division-level, product-line-level — rather than transaction-level detail.
Limitations: Most focus on financial reporting, not pricing-specific analysis. Customer-level and transaction-level profitability requires more specialized tools.
Specialized Profitability and Pricing Analytics
What they do: Transaction-level profitability analysis designed for distribution and manufacturing. They calculate pocket margin, price waterfall, cost-to-serve, and customer profitability at the individual transaction level.
Examples: Vendavo Profit Analyzer, Zilliant analytics module, ProfitOptics.
Cost: $20K-$100K annually as standalone, or bundled with pricing optimization platforms at higher price points.
Best for: Distributors and manufacturers with 5,000+ SKUs, customer-specific pricing, and complex cost structures. These tools understand the distribution pricing model — list price, invoice price, pocket price — in a way that general financial tools don't.
Limitations: Cost and implementation complexity. You're buying industry-specific software that requires data integration, configuration, and training. Implementation takes 2-6 months.
Enterprise CPM Platforms
What they do: Full corporate performance management including budgeting, forecasting, consolidation, and profitability analysis. Profitability is one module within a larger platform.
Examples: Anaplan, OneStream, Oracle Profitability and Cost Management.
Cost: $50K-$300K+ annually. Implementation adds 0.5-2x the first year subscription.
Best for: Large organizations ($200M+ revenue) that need integrated planning, budgeting, and profitability analysis across multiple business units. These are strategic finance platforms, not pricing tools.
Limitations: Massive overkill for mid-market companies. The implementation alone takes 6-12 months and requires dedicated IT and finance resources. The profitability analysis features are powerful but buried in a platform designed for enterprise financial planning.
What Features Matter for Mid-Market Companies
Not every feature on the vendor's website matters for a $75M distributor. Here's what actually drives value.
Must-have features
Customer-level profitability. Not just by name, but by fully loaded cost — including freight, returns, service time, payment terms, and discount levels. This is where the biggest insights live for distributors. SPARXiQ research shows that average distributor EBITDA runs 4%, while top performers hit 8-12%. The gap is usually customer mix profitability.
Product-level margin analysis. Gross margin by SKU is table stakes. Contribution margin after allocating variable costs is where you find products that look profitable but aren't.
Cost-to-serve allocation. The ability to allocate logistics, service, and operational costs to individual customers and transactions. This is what separates profitability analysis from basic margin reporting.
Data integration with your ERP. The tool needs to pull transaction data, cost data, and customer data from your system without requiring a data engineering project. For most mid-market companies, that means the tool accepts CSV exports at minimum and has ERP connectors as a bonus.
Nice-to-have features
Price waterfall visualization. Showing the cascade from list price to invoice price to pocket price for each customer and product. This reveals where margin erodes. See our price waterfall analysis guide for why this matters.
Trend tracking. Profitability by customer and product over time. Catching a customer whose margin has dropped from 25% to 12% over 18 months gives you time to act before it hits zero.
Scenario modeling. "What if we raise prices 3% on this product line?" or "What if we eliminate free freight for orders under $500?" The ability to model profitability impact before making changes.
Features you probably don't need yet
AI-driven recommendations. At the mid-market level, the insights from basic profitability analysis are so actionable that AI adds marginal value. Know which customers are underwater first. Optimize with algorithms later.
Real-time profitability dashboards. For most distributors, profitability doesn't change by the hour. Monthly or quarterly analysis is sufficient. Real-time adds cost and complexity without proportional value.
Multi-entity consolidation. If you're a single-location distributor, you don't need platform features designed for multi-national corporations with 15 subsidiaries.
Build vs. Buy: When Each Makes Sense
Build (Excel/BI tools) when:
- You have under 5,000 SKUs
- Your cost structure is relatively simple (COGS + freight + basic overhead)
- You have someone on staff who can build and maintain spreadsheet models
- You haven't done profitability analysis before (start here to understand your data)
- Budget is constrained
The math: an analyst spending 20 hours building a profitability model in Excel that reveals $200K in addressable margin problems delivers infinite ROI on the tool cost.
Buy mid-market tools when:
- You have 5,000-20,000 SKUs
- Cost allocation requires more than a few formulas (multiple cost pools, activity-based costing)
- Quarterly manual analysis can't keep pace with business changes
- You need profitability reporting accessible to multiple people, not one analyst's laptop
- Budget allows $20K-$80K annually
The math: a $40K/year tool that saves your analyst 200 hours per year and catches $300K in margin problems you'd otherwise miss pays for itself several times over.
Buy enterprise platforms when:
- You have 20,000+ SKUs with complex multi-tier distribution
- You need integrated planning, budgeting, and profitability across business units
- Multiple analysts and finance teams need shared access and governance
- Revenue exceeds $200M with multiple product divisions
If this describes your company, you're probably not reading a blog post to make this decision. You're in vendor demos already.
Getting Started Without Software
The fastest path to profitability insights doesn't start with buying a tool. It starts with your data.
Step 1: Export 12 months of transaction data from your ERP. Invoice lines with revenue, COGS, customer, product, date, and any discount or adjustment codes.
Step 2: Calculate gross margin by product and by customer. Sort both lists from lowest to highest margin. The bottom 10% of each list is where the problems concentrate.
Step 3: Estimate cost-to-serve for your top 50 customers. Allocate freight costs from shipping records. Estimate service costs from call logs or ticket counts. Calculate effective payment terms from AR aging. Even rough estimates reveal which profitable-looking customers are actually breakeven or worse.
Step 4: Quantify the opportunity. How much margin is sitting in the bottom-decile products? How much cost-to-serve is unaccounted for in your worst customers? Put dollar amounts on the problems.
If the opportunity is under $50K, keep managing it in Excel. If it's $100K+, you have the business case for dedicated tools.
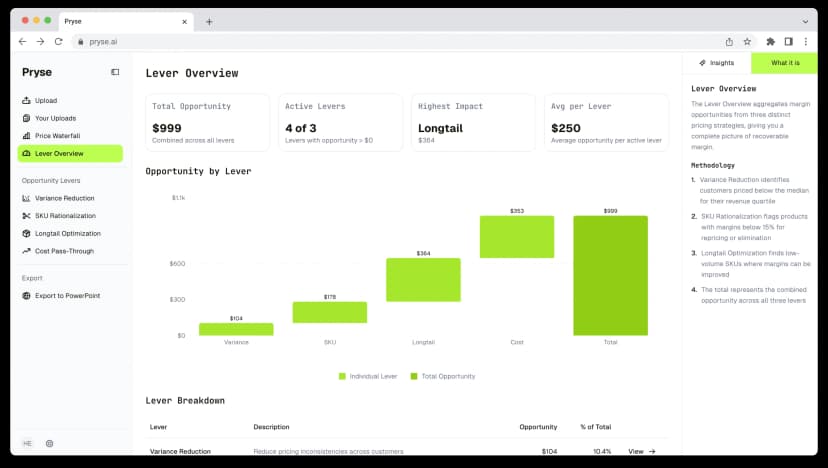
For companies that want professional profitability analysis without the commitment of ongoing software, Pryse delivers transaction-level margin analysis, customer and product profitability, and price waterfall visualization for $999/year. It's designed for exactly this step — quantifying the opportunity before committing to larger investments.
Common Mistakes Mid-Market Buyers Make
Buying enterprise tools for mid-market problems. A $75M distributor doesn't need Anaplan. The implementation will take longer than the analysis, and most features will go unused. Match tool complexity to business complexity.
Confusing reporting with analysis. Dashboards that show your overall margin trend aren't profitability analysis. Analysis requires drill-down to the customer and product level, cost allocation below the COGS line, and actionable identification of where to focus improvement efforts.
Ignoring data quality. Every profitability tool is constrained by data quality. If your ERP has incorrect cost records, duplicate customers, or missing product categories, the software will produce precise but wrong answers. Budget time for data cleanup before implementation.
Skipping the diagnostic. Companies that jump straight to annual software subscriptions often discover their profitability problems were simpler than expected. A one-time analysis that identifies the top 5 margin issues is often all a mid-market company needs to act.
For a deeper look at margin analysis methods, see our margin analysis guide. For a comparison of pricing platforms that include profitability features, see our best pricing software buyer's guide.
Last updated: March 12, 2026
Frequently Asked Questions
Want to analyze your entire product catalog?
Pryse automatically identifies margin leakage across thousands of SKUs. Upload your data and find hidden profit in 24 hours.
$999/year. Cancel anytime.