9 B2B Pricing Examples From Distribution and Manufacturing (With Real Numbers)
Concrete B2B pricing examples from distribution and manufacturing companies. See how cost-plus, tiered, value-based, and dynamic pricing work with actual numbers.
B2B pricing examples are specific, documented cases of how businesses set prices for other businesses, including the model used, the variables considered, and the financial outcome.
Most "B2B pricing examples" articles give you SaaS screenshots and subscription tiers. That's not helpful if you're a $60M electrical distributor with 30,000 SKUs trying to figure out why your margins keep shrinking.
This article covers nine real pricing approaches used in distribution and manufacturing, with actual dollar figures. Each example shows how the pricing model works, where it falls apart, and what it costs you when it goes wrong.
Why B2B Pricing Examples Matter for Distribution and Manufacturing
Here's the uncomfortable reality: according to a Vendavo survey of 300 C-suite executives, only 54% of manufacturers and distributors use any kind of price optimization strategy. The other 46% are winging it with inherited spreadsheets and gut-feel markups.
That gap represents real money. McKinsey's 2003 article "The Power of Pricing" in The McKinsey Quarterly found that a 1% improvement in price realization boosts operating profits by approximately 8% for the average S&P 1500 company. For a $50M distributor running 4% net margins, that 1% price improvement adds $435,000 to the bottom line. No cost cutting required.
The problem isn't that people don't understand pricing theory. It's that they haven't seen what different pricing models look like when applied to their own business. These examples fix that.
Example 1: Straight Cost-Plus Pricing (The Baseline)
Cost-plus pricing sets selling price by adding a fixed percentage markup to the total product cost.
A building materials distributor buys pressure-treated lumber from three mills. Their pricing is straightforward:
Selling Price = Product Cost x (1 + Markup Percentage)
| Product | Cost per Unit | Markup | Selling Price |
|---|---|---|---|
| 2x4x8 PT Lumber | $6.20 | 28% | $7.94 |
| 2x6x12 PT Lumber | $11.40 | 28% | $14.59 |
| 4x4x8 PT Lumber | $14.80 | 28% | $18.94 |
Every product gets the same 28% markup. Simple, consistent, easy to manage in a spreadsheet.
Where it breaks down: That 2x4x8 is a commodity. Home Depot sells it for $7.48. The distributor's $7.94 price loses on every bid. Meanwhile, the 4x4x8 is a specialty item with less competition, and they could charge $21+ without losing volume.
A flat cost-plus approach leaves money on both ends: you're overpriced on commodities and underpriced on specialty items. For a distributor carrying 15,000 SKUs, even a few points of mispricing across the catalog compounds fast.
The fix: Keep cost-plus as your floor, then layer in competitive and value-based adjustments by product category. More on that in examples 4 and 5.
Example 2: Tiered Volume Pricing
Tiered volume pricing sets different per-unit prices based on quantity purchased. Buyers pay one rate for the first block of units, a lower rate for the next block, and so on.
An industrial fastener distributor structures hex bolt pricing like this:
| Quantity (units) | Price per Unit | Total at Max Qty |
|---|---|---|
| 1 - 499 | $0.42 | $209.58 |
| 500 - 2,499 | $0.36 | $899.64 |
| 2,500 - 9,999 | $0.31 | $3,099.69 |
| 10,000+ | $0.27 | Varies |
The distributor's cost is $0.22 per unit. At the top tier, they're still making 22.7% gross margin. At the lowest tier (single-unit orders), they're at 47.6% gross margin.
Where it breaks down: A contractor orders 490 units every two weeks instead of 1,000 monthly. They stay in the top price tier, the distributor processes twice as many orders, and the freight cost doubles. The customer games the tier structure while actually costing more to serve.
The fix: Set tier breaks based on annual volume commitments, not individual order sizes. A customer committing to 25,000 units per year gets the $0.27 rate on every order, regardless of order size. This is where contract pricing becomes the better model for high-volume accounts.
Example 3: Customer-Segment Pricing
Customer-segment pricing assigns different price levels to different buyer categories based on their purchasing behavior, order patterns, and price sensitivity.
A food service distributor selling cooking oil uses three customer segments:
| Segment | Customer Type | Price per Case | Margin |
|---|---|---|---|
| A | Large restaurant chains (500+ cases/mo) | $38.40 | 22% |
| B | Independent restaurants (50-499 cases/mo) | $44.80 | 33% |
| C | Small cafes/catering (under 50 cases/mo) | $49.60 | 39% |
The cost per case is $30.00 across the board.
Segment A customers order predictably, take full pallets, and pay within 15 days. Segment C customers order odd quantities, need split deliveries, and stretch payment to 45 days. The price difference reflects the actual cost-to-serve gap between segments.
Where it breaks down: Segment assignment gets political. A sales rep classifies a 200-case customer as Segment A because they "have potential." Six months later, the customer's still at 200 cases but paying Segment A prices. Multiply that across 40 reps and 2,000 accounts, and you've got systematic margin leakage.
The fix: Tie segment assignment to trailing 12-month purchase data, not sales rep judgment. Review quarterly. If a customer drops below the threshold for 90 days, they automatically move to the next tier. No exceptions without VP approval.
Example 4: Matrix Pricing (Segment + Product Category)
Matrix pricing combines customer segmentation with product categorization to set prices at the intersection of who's buying and what they're buying.
An electrical distributor builds a pricing matrix across two dimensions:
Customer tiers (based on annual spend):
- Platinum: $500K+ annually
- Gold: $100K-$499K annually
- Silver: Under $100K annually
Product categories (based on competitive intensity):
- Category A: Commodity (wire, conduit, boxes) - high price sensitivity
- Category B: Standard (breakers, switches, panels) - moderate sensitivity
- Category C: Specialty (automation, controls, custom) - low sensitivity
The resulting markup matrix:
| Cat A (Commodity) | Cat B (Standard) | Cat C (Specialty) | |
|---|---|---|---|
| Platinum | 18% | 24% | 32% |
| Gold | 22% | 28% | 38% |
| Silver | 26% | 33% | 44% |
This creates nine price points for every product instead of one. A Platinum customer buying commodity wire gets 18% markup. A Silver customer buying specialty controls pays 44% markup. Both prices are defensible because they reflect volume economics and competitive reality.
Where it breaks down: Maintaining a matrix across 25,000 SKUs and 1,500 customers means 37.5 million potential price points. Without software, it degrades to "whatever markup the rep remembers." This is exactly why pricing strategy needs to be systematized, not left to tribal knowledge.
The fix: Automate the matrix. Assign every SKU to a product category and every customer to a tier. Let the system apply markups. Sales reps can request exceptions, but the baseline price is always calculated, never guessed.
Example 5: Value-Based Pricing
Value-based pricing sets prices based on the economic value a product delivers to the customer, not the cost to produce or distribute it.
A specialty chemical manufacturer sells a rust-prevention coating to equipment OEMs. The cost comparison for the customer:
| Factor | Standard Coating | Specialty Coating |
|---|---|---|
| Material cost per unit | $3.20 | $8.50 |
| Application time (labor) | 45 min ($37.50) | 15 min ($12.50) |
| Warranty claims (per 1,000 units) | 23 claims at $180 each = $4,140 | 3 claims at $180 each = $540 |
| Total cost per 1,000 units | $7,340 | $9,040 |
| Adjusted cost including warranty | $11,480 | $9,580 |
The specialty coating costs 2.6x more per unit but saves the customer $1,900 per 1,000 units when you factor in labor and warranty costs.
A cost-plus approach would price the $8.50 product at maybe $11.50 (35% markup). But the value-based price? The manufacturer charges $14.00 per unit and still saves the customer money compared to the cheap alternative. That's a 65% gross margin instead of 35%.
Where it breaks down: Value-based pricing requires that you actually know your customer's economics. If you can't quantify the labor savings and warranty reduction, you're just guessing. And if the customer doesn't believe your numbers, you've got an expensive product with no justification.
The fix: Build value calculators for your highest-margin products. Document three to five real customer outcomes with specific savings figures. When a sales rep can say "Acme Manufacturing saved $47,000 last year switching to this product," the price conversation changes completely.
Example 6: Negotiated/Contract Pricing
Negotiated pricing establishes custom price agreements between buyer and seller, typically documented in annual or multi-year contracts with specific terms for volume, payment, and service levels.
An HVAC distributor negotiates annual contracts with large mechanical contractors. Here's what one contract looks like:
| Term | Details |
|---|---|
| Base pricing | 8% below published price list |
| Volume rebate | Additional 2% on purchases above $750K |
| Payment terms | Net 30 (standard is Net 15) |
| Freight | Free delivery on orders over $2,500 |
| Price protection | Locked for 6 months; quarterly review after |
On the surface, this looks like a good deal: the contractor gets 8% off list, and the distributor locks in a $900K annual account.
Where it breaks down: Stack the concessions. The 8% list discount, plus the 2% volume rebate, plus the extended payment terms (worth roughly 1.5% in carrying cost), plus free freight (averaging 3% of order value) puts the real discount at 14.5%. If the distributor's standard gross margin is 24%, they're actually running 9.5% gross on this "big" account.
That's before you count the cost of the dedicated sales rep, the priority warehouse picks, and the Saturday delivery requests.
This is the price waterfall problem. Invoice price looks healthy. Pocket price tells a different story.
The fix: Calculate the pocket price for every contract account before renewal. Include every off-invoice concession: rebates, freight, payment terms, special services. If the pocket margin falls below your minimum threshold (say, 15% gross), either restructure the deal or walk away. For more on building negotiated pricing guardrails, see our dedicated guide.
Example 7: Geographic/Zone Pricing
Geographic pricing adjusts prices based on delivery location, accounting for freight costs, regional competition, and local market conditions.
A concrete products manufacturer sells precast panels from two plants:
| Delivery Zone | Distance | Freight Cost per Panel | Product Price | Delivered Price |
|---|---|---|---|---|
| Zone 1 (0-50 mi) | Local | $85 | $620 | $705 |
| Zone 2 (50-150 mi) | Regional | $210 | $620 | $830 |
| Zone 3 (150-300 mi) | Extended | $385 | $620 | $1,005 |
| Zone 4 (300+ mi) | Long haul | $580 | $620 | $1,200 |
The product price stays flat. Freight cost dominates in distant zones.
Some manufacturers absorb partial freight to win bids in contested markets. A competitor 40 miles from a Zone 3 jobsite is quoting $780 delivered. So you eat $100 of freight and match at $905. You still make money, just less.
Where it breaks down: Sales reps start absorbing freight on every deal without tracking it. "I had to match the competition" becomes the default, and freight absorption turns into a hidden discount program. One manufacturer I worked with discovered $2.3M in annual freight giveaways that nobody was tracking.
The fix: Make freight a visible line item. Track absorption by rep, by customer, by zone. Set a freight absorption budget per territory. When the budget runs out, the rep needs approval for further concessions. Visibility kills margin leakage.
Example 8: Dynamic/Market-Based Pricing
Dynamic pricing adjusts prices in response to market conditions, raw material costs, competitive moves, or demand shifts, sometimes in real time.
A steel service center buys hot-rolled coil and sells cut-to-length sheets. Their raw material cost swings 30-40% within a single year. Here's a simplified quarter:
| Month | HRC Cost per Ton | Markup | Selling Price per Ton | Gross Margin |
|---|---|---|---|---|
| January | $680 | 32% | $898 | 24.3% |
| February | $740 | 28% | $947 | 21.9% |
| March | $820 | 24% | $1,017 | 19.4% |
Notice the margin compression. As costs rise, the service center can't pass through 100% of increases immediately. Customers push back. Contracts lock in prices for 30-60 days. The markup percentage drops because the dollar markup isn't growing as fast as the cost base.
Going the other direction is just as dangerous. When steel prices drop, the service center is sitting on $820/ton inventory they need to sell in a $680/ton market.
Where it breaks down: Manual price updates can't keep pace. If your pricing team needs two weeks to publish a new price sheet, you're always selling at last month's margin. McKinsey's 2021 article "Digital pricing transformations: The key to better margins" found that companies implementing digital pricing transformations see 2-7 percentage points of sustained margin improvement compared to those updating prices manually.
The fix: Tie pricing formulas to a raw material index. When HRC moves more than 3% in a week, the system flags affected SKUs for automatic repricing. Customers on contract get the contracted price; spot buyers get the current market price. No spreadsheet can run this across 10,000 SKUs. You need a system.
Example 9: Bundled/Kit Pricing
Bundled pricing combines related products into a single package at a price lower than buying each item separately, driving higher average order values while moving slow-turning inventory.
A plumbing distributor creates rough-in kits for new construction:
| Component | Individual Price | Kit Price | Savings |
|---|---|---|---|
| 3/4" Copper (100 ft) | $142.00 | - | - |
| 1/2" Copper (200 ft) | $198.00 | - | - |
| Fittings assortment | $86.00 | - | - |
| Flux and solder | $34.00 | - | - |
| Hangers and supports | $52.00 | - | - |
| Individual total | $512.00 | - | - |
| Kit price | - | $449.00 | $63.00 (12.3%) |
The distributor's blended cost for the kit is $338. At $449, they're running 24.7% gross margin. If customers bought everything separately at list, the margin would be 34%. But here's the thing: most customers don't buy everything. They buy the copper and the fittings, skip the flux and hangers (they've got leftovers on the truck), and the distributor misses the higher-margin accessories entirely.
The kit guarantees the full basket. Lower margin percentage, but higher margin dollars per transaction.
Where it breaks down: Kit pricing assumes relatively stable component costs. When copper spikes 15% in a quarter, the kit price is underwater before anyone updates it. Also, contractors start expecting the kit discount on everything, even when they cherry-pick components.
The fix: Price kits as a percentage discount off current component pricing, not as a fixed dollar amount. When copper goes up, the kit price adjusts automatically. And make the kit discount contingent on buying the full kit. No substitutions, no partial kits at the kit price.
How to Pick the Right Pricing Model
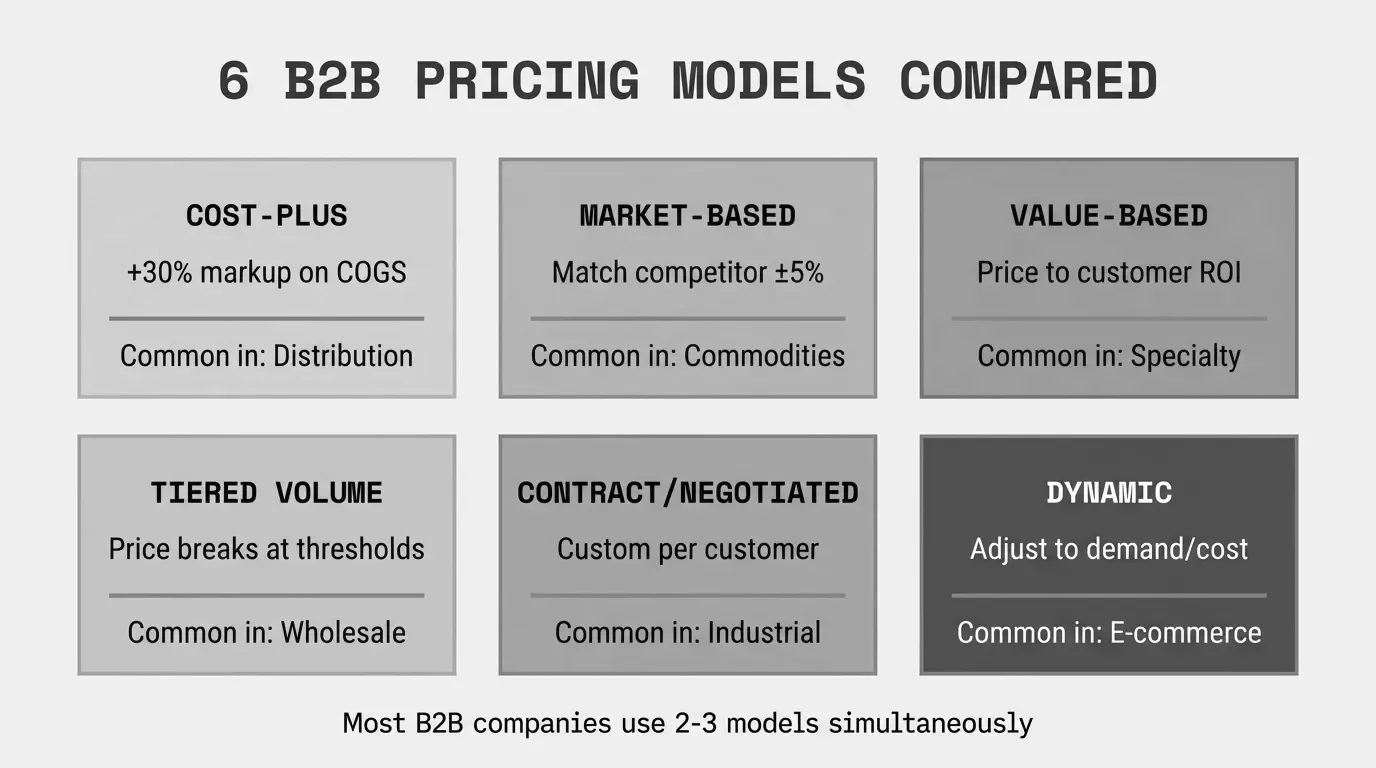
No single model works across your entire business. Most distributors and manufacturers end up running three or four of these simultaneously:
| Business Situation | Best Pricing Model | Why |
|---|---|---|
| Commodity products, many competitors | Cost-plus with market adjustments | You need to stay competitive; margin comes from efficiency |
| High-volume accounts, annual commitments | Contract/negotiated pricing | Lock in volume, manage margin with guardrails |
| Specialty products, few alternatives | Value-based pricing | Capture the economic value you deliver |
| Volatile raw materials | Dynamic/market-based | Protect margin when costs swing |
| Mixed-use customers, broad catalog | Matrix pricing | Systematize what your best reps do intuitively |
The real question isn't which model to pick. It's whether you can actually execute it. A matrix pricing strategy on a whiteboard is worthless if your reps are still quoting from memory and your prices live in a spreadsheet that hasn't been updated since September.
Measuring What Your Pricing Actually Produces
Every pricing example above has a gap between the intended price and the pocket price, the amount that actually hits your bank account after every discount, rebate, freight concession, and payment term adjustment.
Pocket Price = List Price - On-Invoice Discounts - Off-Invoice Deductions - Freight Absorption - Payment Term Cost
The average B2B distributor's pocket price runs 20-30% below their invoice price. That's not a rounding error. On $50M in revenue, the difference between a 22% and 27% pocket margin is $2.5M in annual profit.
If you don't know your pocket price by customer, by product category, and by sales rep, you can't tell which of these pricing models is actually working.
That's what Pryse does. Upload your transaction data and see exactly where the margin is leaking: which customers, which products, which reps, and how much it's costing you. Start your pricing diagnostic and get answers in 24 hours, not 6 months.
Further Reading
For a deeper dive into pricing strategy fundamentals, start with our complete guide. If you're specifically working through contract pricing structures or negotiated pricing for key accounts, those guides break down the mechanics in detail.
Last updated: Invalid Date
Frequently Asked Questions

Want to analyze your entire product catalog?
Pryse automatically identifies margin leakage across thousands of SKUs. Upload your data and find hidden profit in 24 hours.
One-time $1,499 diagnostic. No subscription required.