B2B Tiered Pricing: How to Structure Tiers That Protect Margins
Learn how to build tiered pricing for B2B distribution and manufacturing. Includes breakpoint formulas, tier structures, and margin protection strategies.
B2B tiered pricing is a pricing model where the per-unit cost of a product decreases as the quantity purchased increases, with each quantity band carrying its own specific rate. Unlike a flat discount, tiered pricing applies different prices to different portions of an order based on predefined breakpoints.
If you're running a $50M distribution company with 10,000 SKUs and your pricing lives in a spreadsheet, your tier structure is almost certainly leaking margin. I've seen it in dozens of mid-market distributors: the tiers were set five years ago by someone who's no longer at the company, the breakpoints don't match actual order patterns, and nobody's checked whether the bottom tier still clears cost.
This guide covers how to structure tiers that actually protect your margins, where to set breakpoints, and how to avoid the most common mistakes that turn tiered pricing into a margin drain.
How Tiered Pricing Works in Distribution and Manufacturing
Here's the mechanic that matters: with tiered pricing, only the units inside each band get that band's rate.
Say you sell industrial fasteners. Your tiers look like this:
| Quantity Band | Price Per Unit |
|---|---|
| 1-99 units | $2.40 |
| 100-499 units | $2.10 |
| 500+ units | $1.85 |
A customer orders 600 units. Here's how the invoice breaks down:
(99 x $2.40) + (400 x $2.10) + (101 x $1.85) = $237.60 + $840.00 + $186.85 = $1,264.45
That's an effective per-unit price of $2.11. The customer gets rewarded for buying more, but you don't give away your margin on the first 99 units at the lowest rate.
Compare this to volume pricing, where hitting 500+ units would apply $1.85 to all 600 units, totaling $1,110. That's $154.45 less revenue on the same order. Over thousands of transactions per year, this structural difference adds up fast.
Tiered Pricing vs. Volume Pricing: Which One Protects Margin Better?
This is the single most important distinction in B2B pricing, and most distributors I've worked with get it wrong or don't realize they have a choice.
Tiered pricing applies each band's rate only to units within that band. Revenue increases smoothly as order size grows. There's never a scenario where selling one more unit drops your total revenue.
Volume pricing applies the qualifying tier's rate to every unit once a threshold is crossed. This creates cliff effects: a customer ordering 499 units might pay more total than a customer ordering 500, because the 500th unit triggers a lower rate across all units.
| Tiered Pricing | Volume Pricing | |
|---|---|---|
| Discount applies to | Units within each band | All units in the order |
| Revenue at breakpoints | Smooth, always increasing | Can drop (cliff effect) |
| Margin predictability | High | Lower near thresholds |
| Customer perception | Slightly more complex | Easier to understand |
| Best for | Margin protection | Incentivizing large orders |
For distributors and manufacturers managing thousands of SKUs, tiered pricing almost always makes more sense. The margin protection compounds across your catalog. Volume pricing works better for commodity plays where you're competing purely on price and want maximum order-size incentive.
If you want to go deeper on choosing the right model, our pricing strategy guide covers the full decision framework.
How Many Tiers Should You Have?
Three to four tiers is the sweet spot for most B2B distribution and manufacturing companies. That's not a guess. It's what the data supports.
Two tiers is too blunt. You're leaving money on the table with mid-volume buyers who'd order more if there was a visible next threshold. You're also giving your largest buyers the same deal as everyone above a single cutoff.
Five or more tiers creates operational headaches. Your sales reps can't remember the breakpoints. Your ERP gets cluttered. Customers call asking which tier they're in. Quoting takes longer.
Three to four tiers gives you enough granularity to segment your customer base without overwhelming anyone. Here's a framework that works across most distribution verticals:
| Tier | Target Buyer | Volume Range | Discount off List |
|---|---|---|---|
| Standard | Small/occasional buyers | 1 to 1x median order | 0% (list price) |
| Preferred | Regular buyers | 1x to 3x median order | 8-15% |
| Volume | Large accounts | 3x to 8x median order | 15-22% |
| Strategic | Top 5% accounts | 8x+ median order | 22-30% |
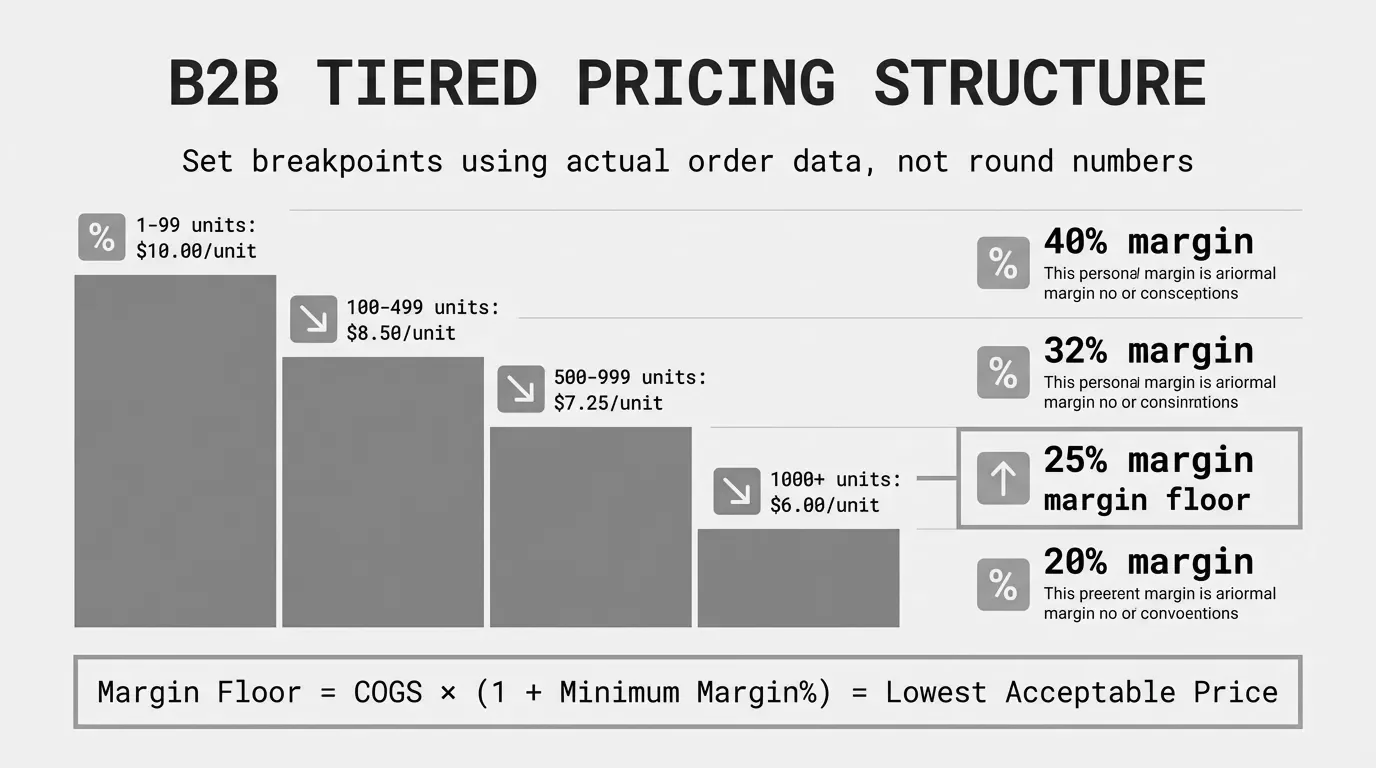
The key: anchor your tier ranges to your actual order data, not round numbers. If your median order for a product category is 72 units, don't set your first breakpoint at 100 just because it's a clean number. Set it at 75 or wherever your order distribution shows a natural cluster.
Setting Breakpoints That Match Real Buying Behavior
Breakpoint analysis is the process of identifying the minimum quantity thresholds where customers qualify for the next pricing tier, based on actual order data rather than arbitrary round numbers.
Bad breakpoints are the number-one source of tier-related margin leakage. Here's how to set them properly.
Step 1: Pull 12 Months of Order Data
Export every line item for the SKUs or product categories you're building tiers for. You need: SKU, quantity ordered, customer ID, and date. If you're managing this in Excel, you probably already have this data somewhere.
Step 2: Build an Order Size Distribution
Plot order quantities on a histogram. You're looking for clusters: natural groupings where lots of orders land. These clusters tell you where your buyers naturally operate.
A typical distribution company will see something like:
- 40% of orders cluster around 20-80 units (small buyers, fill-in orders)
- 30% cluster around 150-300 units (regular replenishment)
- 20% cluster around 500-800 units (large restocks)
- 10% are 1,000+ (bulk buys, project orders)
Step 3: Set Breakpoints Between Clusters
Your tier thresholds should sit in the gaps between clusters, not inside them. If a cluster of orders sits at 150-300 units, don't put a breakpoint at 200. Put it at 125 or 300 so the tier either captures the whole cluster or sits above it.
The goal: each breakpoint should be just above a cluster so that customers naturally fall into a tier, and the next tier is within reach for buyers who might stretch their order.
Step 4: Validate Against Pack Sizes and Logistics
Your breakpoints should align with operational realities. If product ships in cases of 24, set breakpoints at multiples of 24, not at 25 or 50. If a pallet holds 144 units, a breakpoint at 144 makes sense. Customers already think in these terms. When tier thresholds match the quantities they'd order anyway, adoption is frictionless.
Step 5: Stress-Test the Margin Floor
This is where most companies skip a step and bleed margin later. For each tier, calculate:
Margin Floor = (Tier Price - Fully Loaded Cost) / Tier Price x 100
"Fully loaded cost" means COGS plus freight, handling, warehousing allocation, and any rebates you're counting on. If your bottom tier drops below your target margin (say, 25% gross for general distribution), widen the discount steps or raise the breakpoint.
Run this calculation for every SKU category at every tier. A tier that's profitable on your high-margin fasteners might be underwater on your commodity pipe fittings.
The Margin Leakage Problem in Tiered Pricing
Tiered pricing doesn't automatically protect your margins. Poorly managed tiers are one of the most common sources of margin leakage in distribution and manufacturing.
According to McKinsey's "Pricing: Distributors' most powerful value-creation lever" (2019), a 1% price increase yields a 22% increase in EBITDA margins for the average distributor. And the inverse is equally punishing: McKinsey's study of the Global 1200, cited in Rafi Mohammed's The 1% Windfall (2010), found that a 1% price reduction can cause an 11% dip in operating profit.
Here's where the leakage typically shows up:
Stale Breakpoints
If your tiers haven't been updated in 2+ years, they're probably wrong. Raw material costs shift. Freight rates change. Your customer mix evolves. Breakpoints that made sense in 2023 might be giving away margin today.
One industrial distributor I worked with hadn't touched their tiers in four years. Their bottom tier had eroded to 18% gross margin on a product line where their target was 28%. Across 3,000 SKUs in that category, the annualized leakage was $340,000.
Manual Overrides Without Guardrails
Sales reps override tier prices to close deals. That's normal. The problem is when there's no approval workflow and no margin floor enforcement. A distributor in the Midwest found that one sales territory was consistently applying 5-7% more in off-invoice discounts than any other, with no corresponding increase in volume. That's not selling. That's giving away margin.
Misaligned Tier Assignment
Customers get placed in the wrong tier, either through data entry errors or through "temporary" upgrades that become permanent. When you've got thousands of customers and tens of thousands of SKUs, these misassignments multiply. I've seen companies where 15-20% of customer-tier assignments didn't match actual purchase volumes.
Rebate Miscalculation
If your tier pricing depends on capturing supplier rebates to hit margin targets, you need to verify those rebates are actually flowing through. Many distributors build tier pricing assuming 2-3% in back-end rebates. When the rebate structure changes or thresholds aren't met, the margin math falls apart.
For a broader look at where margin disappears, see our guide on margin leakage in distribution.
Building a Tier Structure: Step-by-Step Example
Let's walk through building a tier structure for an electrical distributor with $80M in revenue, 8,000 SKUs, and 1,200 active customers. I'll use a real product category: circuit breakers.
Current State
- Average list price: $45/unit
- COGS: $29/unit
- Current gross margin: 35.6%
- Annual volume: 48,000 units
- No formal tier structure. Reps discount by feel.
Order Data Analysis
Pulling 12 months of order data reveals these clusters:
- Cluster A: 5-20 units (electrical contractors, small jobs) — 52% of orders
- Cluster B: 50-120 units (panel shops, mid-size projects) — 31% of orders
- Cluster C: 250-500 units (large contractors, OEM builds) — 12% of orders
- Cluster D: 1,000+ units (national accounts, major projects) — 5% of orders
Proposed Tier Structure
| Tier | Quantity | Unit Price | Discount | Gross Margin |
|---|---|---|---|---|
| Standard | 1-49 | $45.00 | 0% | 35.6% |
| Preferred | 50-249 | $40.50 | 10% | 28.4% |
| Volume | 250-999 | $37.35 | 17% | 22.3% |
| Strategic | 1,000+ | $34.65 | 23% | 16.3% |
Margin Validation
Even the Strategic tier clears the 15% gross margin floor for this category. The blended margin across all tiers, weighted by volume:
Blended Margin = (Cluster A volume x 35.6%) + (Cluster B volume x 28.4%) + (Cluster C volume x 22.3%) + (Cluster D volume x 16.3%)
= (52% x 35.6%) + (31% x 28.4%) + (12% x 22.3%) + (5% x 16.3%)
= 18.5% + 8.8% + 2.7% + 0.8%
= 30.8%
That 30.8% blended margin is a 4.8-point improvement over what the unstructured "discount by feel" approach was producing (their actual blended margin was running at 26%). On $80M in revenue, that's roughly $3.8M in recovered margin.
What Changed
The reps were previously discounting the small-order customers too aggressively because there was no structure. When a contractor ordering 15 units asks for a discount, it's hard to say no without a published tier card. With formal tiers, the answer becomes straightforward: "You're at Standard pricing. Order 50+ and you'll move to Preferred."
Common Mistakes in B2B Tiered Pricing
After building tier structures for companies across electrical, plumbing, HVAC, and industrial distribution, I keep seeing the same five mistakes:
1. Setting the same tiers across all product categories. A tier that works for high-margin specialty products will destroy margin on commodity lines. Build separate tier structures for product categories with materially different cost structures.
2. Ignoring cost-to-serve differences. Shipping 1,000 units to a single dock is cheaper than shipping 50 units to 20 locations. Your tiers should account for this. A customer ordering 1,000 units across 20 POs of 50 isn't a Volume buyer; they're a Preferred buyer who orders frequently.
3. No quarterly review cadence. Raw material costs, freight rates, and competitor pricing shift constantly. Tiers need at least quarterly review. Annual reviews are too slow for most distribution verticals.
4. Letting customers self-select tiers. Tiers should be assigned based on actual trailing purchase data, not commitments or projections. "We'll order 500 units this year" isn't the same as actually ordering 500 units. Use rolling 12-month actuals.
5. Discounting from the wrong starting point. Your list price needs to be credible. If nobody pays list, your tier discounts are fiction. Set list price at a level where at least 30-40% of your small-order customers actually pay it.
How to Roll Out Tiered Pricing Without Losing Customers
Switching from ad-hoc discounting to formal tiers is a sensitive transition. Some customers will see a price increase. Here's how to manage it:
Grandfather existing customers for 90 days. Give your current accounts a transition window. This builds goodwill and gives your sales team time to have proper conversations.
Lead with the upside. Most customers will see a clear path to lower pricing by consolidating orders. Frame the tier structure as "here's how to save more" rather than "here's your new price."
Arm your sales team with tier cards. A one-page PDF per product category showing tiers, breakpoints, and per-unit prices. Make it so simple that reps can pull it up on their phone during a customer visit.
Track migration monthly. In the first six months, watch for customers who dropped a tier versus the old arrangement. If more than 10% of revenue is affected negatively, your breakpoints might need adjustment.
Codify in your ERP. If your tiers live in a spreadsheet, they'll get overridden. Build the tier logic into whatever system generates quotes and invoices, whether that's SAP, NetSuite, Microsoft Dynamics, or even a well-structured Excel template. The system should flag any price below the tier floor for approval.
Tiered Pricing for Manufacturers vs. Distributors
The mechanics are the same, but the inputs differ.
Manufacturers can set breakpoints around production economics. A breakpoint at 500 units might align with a minimum production run. A breakpoint at 5,000 units might correspond to a full shift. The discount at each tier can directly reflect the per-unit cost savings from longer runs, less changeover, and better material purchasing.
Distributors set breakpoints around logistics and purchasing power. A breakpoint at one pallet (say, 144 units) reflects real freight savings. A breakpoint at a full truckload reflects even more. Distributors also need to factor in the margin they need to cover their cost-to-serve: warehousing, credit extension, delivery, and sales coverage.
For manufacturers selling through distributors, the tier structure gets layered: the manufacturer offers tiers to the distributor, and the distributor offers separate tiers to end customers. Making sure both sets of tiers are aligned, so neither party's margin gets squeezed, takes coordination. We cover this dynamic in depth in our pricing strategy guide.
Measuring Tier Effectiveness
Once your tiers are live, track these four metrics monthly:
1. Tier adoption rate. What percentage of revenue falls in each tier? If 80% of revenue is in your bottom tier, your breakpoints are too high or your discounts aren't motivating enough.
2. Tier migration. Are customers moving up to higher tiers over time? That's the point of tiered pricing: to incentivize growth. If nobody's migrating, the tiers aren't working as growth levers.
3. Override rate. What percentage of invoices are priced below the applicable tier? If more than 5% of lines are being manually overridden, you've got a discipline problem or a tier problem.
4. Blended margin by category. Track your actual blended gross margin monthly versus target. If blended margin is falling while revenue is growing, your tiers might be too generous at the upper levels.
A price waterfall analysis is the most effective way to visualize where your tier-related margin is going. It shows the journey from list price to pocket price, making every discount, rebate, and concession visible.
When Tiered Pricing Doesn't Work
Tiered pricing isn't the right model for every situation.
Highly commoditized products with transparent market pricing. If your customers can check your competitor's price in 30 seconds, tiered pricing adds complexity without leverage. Go with simple volume pricing or market-based pricing.
Custom or engineered-to-order products. When every order is different, tiers don't apply. Use project-based or cost-plus pricing instead.
Very low SKU counts with very high unit values. If you sell 50 SKUs at $10,000+ per unit and typical orders are 1-3 units, tiers add nothing. Negotiate deal-by-deal.
For everything else, especially for distributors and manufacturers with thousands of SKUs, diverse customer bases, and order sizes ranging from a few units to truckloads, tiered pricing is one of the highest-leverage pricing strategies you can implement.
Start With Your Highest-Volume Categories
You don't need to build tier structures for 10,000 SKUs at once. Start with the 20% of product categories that drive 80% of revenue. Build tiers for those, measure the impact for one quarter, then expand.
If your pricing lives in spreadsheets today, even getting visibility into what your actual tier-level margins are is a win. Most mid-market distributors don't know their blended margin by customer tier because the data is scattered across ERPs, spreadsheets, and sales rep memory.
That's the problem Pryse solves. Upload your transaction data and see exactly where your tier pricing is working and where it's leaking margin, in 24 hours instead of a six-month consulting engagement.
Last updated: Invalid Date
Frequently Asked Questions

Want to analyze your entire product catalog?
Pryse automatically identifies margin leakage across thousands of SKUs. Upload your data and find hidden profit in 24 hours.
One-time $1,499 diagnostic. No subscription required.