Negotiated Pricing: How Distributors Lose (and Recover) Margin on Every Deal
Negotiated pricing drives 70%+ of B2B revenue but causes massive margin leakage. Learn how to build guardrails, set floor prices, and recover hidden profit.
Negotiated pricing is a B2B pricing method where buyer and seller agree on a custom price through discussion, rather than accepting a fixed list price. The final price depends on volume commitments, relationship history, payment terms, competitive alternatives, and how hard the buyer pushes.
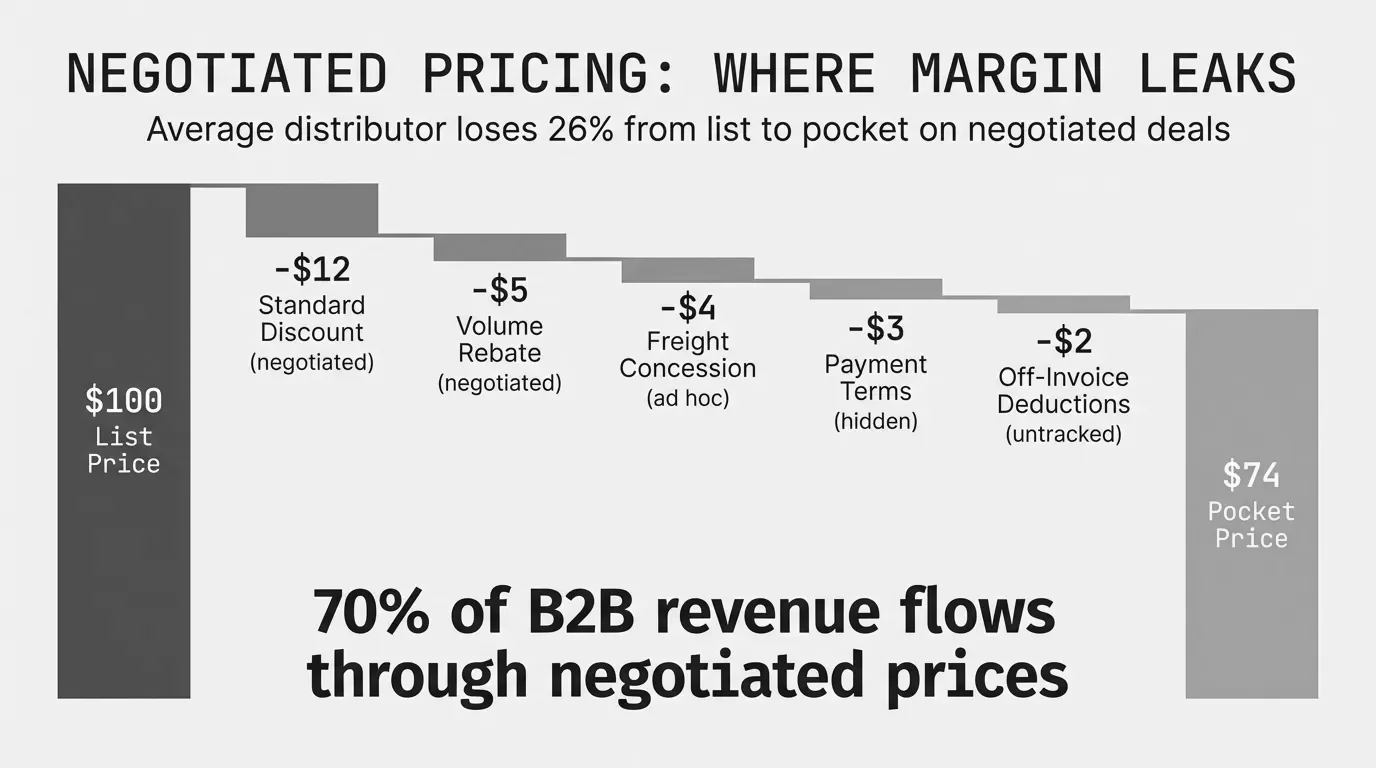
In distribution and manufacturing, negotiated pricing isn't an edge case. It's the default. Over 70% of B2B revenue flows through customer-specific or agreement pricing, according to Zilliant's 2025 analysis "8 Negotiated Pricing Challenges B2B Pricers Can't Ignore." For a $50M distributor with 15,000 SKUs, that means $35M+ in annual revenue is priced through some form of negotiation.
The problem isn't negotiation itself. The problem is that most companies negotiate without guardrails, track deals in spreadsheets, and never revisit agreements after they're signed. That's how margin disappears.
Negotiated Pricing vs. List Pricing
List pricing and negotiated pricing aren't opposites. They're two ends of the same system.
List price is the published starting point. It's standardized, transparent, and almost nobody in B2B actually pays it. Think of it as the anchor.
Negotiated price is the adjusted price after discussions between buyer and seller. It accounts for the customer's volume, strategic value, competitive situation, and willingness to pay.
| Factor | List Pricing | Negotiated Pricing |
|---|---|---|
| Price visibility | Published, same for all | Private, varies by customer |
| Flexibility | None | High |
| Sales team involvement | Minimal | Significant |
| Admin overhead | Low | High (tracking, approvals) |
| Margin risk | Low (predictable) | High (inconsistent discounts) |
| Customer satisfaction | Mixed (one-size-fits-all) | Higher (feels personalized) |
Most distributors run a hybrid. They maintain a list price as the ceiling, then negotiate downward based on customer-specific factors. The gap between list and negotiated price is where your margin lives or dies.
A mid-market building materials distributor I worked with had list prices set at 40% gross margin. Their average negotiated price landed at 22% gross margin. That 18-point spread wasn't intentional strategy. It was 47 sales reps making independent decisions without guidance.
Why Negotiated Pricing Causes Margin Leakage
Negotiated pricing doesn't cause leakage by itself. Unmanaged negotiated pricing does. Here's where the money goes.
1. Stale agreements that never get updated
A supplier raises prices 6%. Your cost goes up. But the negotiated customer price stays locked at last year's rate because nobody flagged it for review. Multiply that across 8,000 SKUs and 200 customer agreements, and you're bleeding margin every day.
Zilliant's 2024 Global B2B Distribution Benchmark Report found that distributors commonly have thousands of pricing agreements where cost increases were never passed through. In one case, 40% of a distributor's active agreements were below their target floor margin.
2. Inconsistent discounting across the sales team
Without clear discount bands, every rep invents their own approach. Rep A gives 12% off list to a $50K/year customer. Rep B gives 25% off list to a $45K/year customer buying the same products. Neither knows what the other is doing.
The coefficient of variation in deal sizes is a useful diagnostic here. Once it hits 30% within comparable customer segments, you've got a pricing discipline problem. Run this analysis monthly. It catches inconsistency before it spreads across your entire book.
3. Discounting rewarded over margin
When sales compensation is tied to revenue or bookings, reps have every incentive to drop price to close. They'll give away 5% more discount to avoid losing a $20K deal, not realizing that 5% across their whole portfolio costs the company $150K in annual margin.
McKinsey's 2003 article "The Power of Pricing" in The McKinsey Quarterly showed that a 1% price increase generates an 8% increase in operating profits for the average S&P 1500 company. The inverse is equally true. Every 1% your reps give away costs you roughly 8% in operating profit.
4. Off-invoice concessions stack up invisibly
Negotiated pricing doesn't end at the invoice. Free freight on orders over $500. Extended payment terms from net-30 to net-60. Free returns. Cooperative marketing funds. Each concession is small. Together, they eat 10-20% more off your pocket price.
Pocket Price = Invoice Price - Rebates - Freight Absorption - Payment Term Cost - Returns - Other Off-Invoice Costs
Most ERP systems track invoice price. Almost none track pocket price. That's the blind spot.
How to Build Guardrails Around Negotiated Pricing
You don't need enterprise pricing software to fix this. You need structure. Here are five things that actually work for mid-market distributors.
Set floor prices by product-customer segment
Every product-customer combination should have a floor price: the absolute minimum a rep can quote without escalation. Calculate it by working backwards from your minimum acceptable margin.
Floor Price = (COGS + Cost-to-Serve) / (1 - Minimum Margin %)
For a product with $60 COGS and $8 cost-to-serve, targeting a 20% minimum margin:
Floor Price = ($60 + $8) / (1 - 0.20) = $85
Anything below $85 requires VP approval. No exceptions. One distributor I worked with reduced discounting requests from 70% of proposals to 30% within a year just by implementing floor prices with an escalation process.
Create discount bands, not unlimited authority
Instead of giving reps free rein, define tiers:
| Customer Annual Revenue | Max Rep Discount | Manager Approval | VP Approval |
|---|---|---|---|
| Under $25K | 5% off list | 6-10% | 11%+ |
| $25K - $100K | 8% off list | 9-15% | 16%+ |
| $100K - $500K | 12% off list | 13-20% | 21%+ |
| $500K+ | 15% off list | 16-25% | 26%+ |
These numbers are illustrative. Your bands depend on your margin structure and competitive position. The point is that every discount has a ceiling before it requires another pair of eyes.
Tie agreements to expiration dates and cost triggers
Every negotiated price agreement should have:
- An expiration date. 12 months maximum. No evergreen agreements.
- A cost adjustment clause. If supplier costs increase more than 3%, you have the right to renegotiate within 30 days.
- A volume commitment. The customer got this price because they promised $200K in annual purchases. If they're tracking at $120K through Q3, the price resets.
Without these triggers, agreements go stale. And stale agreements are the single biggest source of negotiated pricing leakage in distribution.
Track pocket price, not just invoice price
You need to see what you actually collect after all concessions. Build a price waterfall that tracks every deduction from list to pocket:
| Waterfall Step | Example |
|---|---|
| List price | $100.00 |
| Negotiated discount (15%) | -$15.00 |
| Volume rebate (3%) | -$3.00 |
| Freight absorption | -$2.50 |
| Early payment discount (2%) | -$1.70 |
| Pocket price | $77.80 |
| COGS | -$55.00 |
| Pocket margin | $22.80 (22.8%) |
If you're only tracking the negotiated invoice price of $85, you think your margin is 35.3%. Your real margin is 22.8%. That 12.5-point gap is invisible in most ERP reports.
Review the bottom 10% of accounts quarterly
Sort all customer accounts by pocket margin. The bottom 10% get reviewed every quarter. For each one, ask three questions:
- Is the negotiated price still above our floor?
- Has the customer met their volume commitment?
- What would happen if we raised their price 3-5%?
In my experience, about half of bottom-10% accounts accept a modest price increase without pushback. They negotiated hard once and never expected the price to change. The other half either renegotiate to a sustainable level or attrit, which often improves your portfolio margin anyway.
Special Pricing Agreements (SPAs): A Common Negotiated Pricing Structure
A special pricing agreement is a formal contract that sets custom pricing for specific products, usually between a supplier and distributor or a distributor and end customer. SPAs are the backbone of channel pricing in industrial distribution.
They work like this: a manufacturer agrees to sell Widget A to Distributor X at $45 instead of $52 list, because Distributor X committed to $500K in annual Widget A purchases. The distributor then negotiates their own price with end customers, layering margin on top of the SPA price.
SPAs get messy fast. A mid-size industrial distributor might have 2,000-5,000 active SPAs across hundreds of suppliers. Tracking them in spreadsheets means:
- Expired SPAs still being applied (overbilling the supplier, underbilling the customer)
- Volume commitments not being met (supplier claws back the discount)
- New cost increases not reflected in the SPA price (margin compression)
If your SPA management is in Excel, you're probably leaving 1-3% of revenue on the table through tracking errors alone.
Negotiated Pricing in Practice: What Good Looks Like
A $75M electrical components distributor I advised had 12,000 active customer-specific prices across 8,000 SKUs. They tracked everything in their ERP but never analyzed it holistically. Here's what we found:
- 34% of negotiated prices were below the target floor margin of 18%
- 22% of agreements hadn't been reviewed in over 18 months
- Top 5% of customers by revenue had pocket margins ranging from 8% to 31%. Same segment, wildly different profitability
- $2.1M in annual margin was recoverable through systematic price corrections
The fix wasn't complicated. We built a quarterly review cadence, implemented floor prices, added cost-trigger clauses to new agreements, and gave the pricing team a price waterfall view by customer. Within two quarters, average pocket margin improved by 2.3 percentage points.
That's $1.7M in annual profit recovery. No new software. No new headcount. Just structure around pricing decisions that were already being made.
When Negotiated Pricing Makes Sense (and When It Doesn't)
Negotiated pricing isn't universally better or worse than fixed pricing. It depends on your market and operations.
Negotiated pricing works well when:
- You have a manageable number of high-value accounts (under 500)
- Products are differentiated or bundled in ways that justify custom pricing
- Customer relationships are long-term with repeat purchases
- Your sales team has pricing training and clear guardrails
Negotiated pricing breaks down when:
- You have thousands of small accounts getting individual deals (admin cost exceeds margin benefit)
- Reps have no floor prices or discount limits
- Agreements are never reviewed after signing
- You can't track pocket price, only invoice price
For the long tail of small accounts, consider a structured discount matrix instead. Set rules based on customer tier, order size, and product category. Let the matrix do the pricing. Save negotiation for the accounts where the deal size justifies the effort.
This is really a broader pricing strategy decision. Negotiated pricing is one tool. It works best when combined with strong analytics and clear governance.
How to Diagnose Your Negotiated Pricing Health
You don't need six months of consulting to figure out if negotiated pricing is costing you money. Run these five checks with your existing transaction data:
-
Pocket margin distribution. Export 12 months of transactions. Calculate pocket margin per customer. If the standard deviation exceeds 10 percentage points within a single customer segment, you've got inconsistency.
-
Agreement age analysis. How many active negotiated prices are older than 12 months? If it's more than 30%, you have a staleness problem.
-
Floor price violations. How many transactions in the last quarter fell below your cost-to-serve plus minimum margin? If you don't know your floor price, that's your first problem.
-
Discount-to-volume correlation. Plot discount percentage against customer annual revenue. The relationship should be roughly linear (bigger customers get bigger discounts). If the scatter plot looks random, your reps are discounting without logic.
-
Price waterfall gap. Pick your top 20 customers. Calculate both invoice margin and pocket margin. If the average gap exceeds 8 percentage points, off-invoice concessions are eating your profit.
Pryse runs this analysis automatically when you upload your transaction data. You get a price waterfall by customer, margin distribution analysis, and a dollar estimate of recoverable margin, all within 24 hours.
Moving From Reactive to Proactive Negotiated Pricing
Most mid-market distributors negotiate pricing reactively. A customer calls, asks for a better price, and a rep makes a judgment call. That's not a strategy. That's firefighting.
Proactive negotiated pricing means:
- Knowing your walk-away price before the conversation starts
- Segmenting customers by value and price sensitivity so you negotiate differently with a $500K strategic account than a $15K transactional buyer
- Arming reps with data on the customer's purchase history, margin contribution, and competitive alternatives
- Reviewing agreements on a schedule, not when someone remembers
The companies that do this well aren't using $100K/year enterprise tools. They're running regular diagnostics on their transaction data, setting clear guardrails, and holding their teams accountable to margin targets, not just revenue.
That's the difference between negotiated pricing as a source of margin leakage and negotiated pricing as a competitive advantage.
Last updated: Invalid Date
Frequently Asked Questions

Want to analyze your entire product catalog?
Pryse automatically identifies margin leakage across thousands of SKUs. Upload your data and find hidden profit in 24 hours.
One-time $1,499 diagnostic. No subscription required.