How to Price Products: Formulas, Strategies, and Real-World Examples for B2B
Learn how to price products using cost-plus, value-based, and competitive methods. Includes formulas, margin benchmarks, and examples for distribution and manufacturing.
Product pricing is the process of determining what a customer pays for a good or service, based on your costs, the market, and the value you deliver. Get it right and you've got healthy margins. Get it wrong — even by a few percentage points — and the damage compounds across every invoice, every quarter, every year.
Here's what makes pricing so deceptively hard in distribution and manufacturing: you're not pricing one product. You're pricing 5,000 to 100,000 SKUs across hundreds of customers with different contract terms, volume tiers, and competitive situations. A 2% mispricing across 30,000 SKUs doesn't show up as a crisis. It shows up as a slow, invisible bleed that erodes $500K to $2M in annual profit for a $50M company.
This guide covers the core formulas, the major pricing strategies, and the practical steps to price products when you're managing a real-world catalog — not a single product in a textbook.
For the complete framework, see our Pricing Strategy Guide.
The Three Numbers You Need Before Setting Any Price
Before you pick a strategy or run a formula, you need three inputs. Skip any of them and you're guessing.
1. Your true cost per unit. Not just the purchase price or bill of materials. The fully loaded cost includes raw materials, labor, overhead allocation, inbound freight, warehousing, and handling. Most mid-market companies undercount cost by 8-15% because they ignore indirect expenses.
2. Your target margin. Not markup — margin. These are different numbers, and confusing them is one of the most expensive mistakes in B2B pricing. (We'll cover the difference below.)
3. Your customer's alternatives. What happens if they don't buy from you? What do they pay elsewhere? What does it cost them in time, switching effort, and risk? This sets the ceiling on what you can charge.
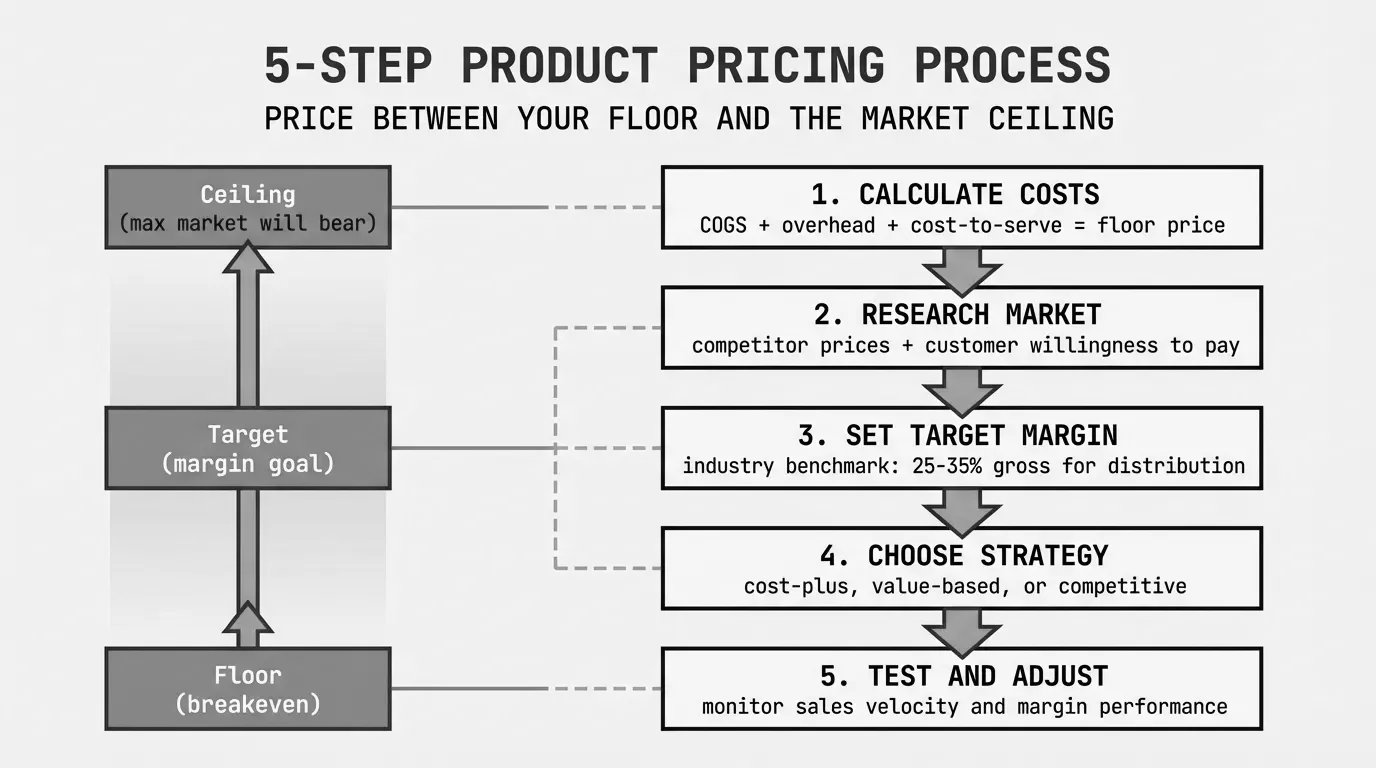
Cost sets your floor. Alternatives set your ceiling. Everything in between is where pricing strategy lives.
Markup vs. Margin: The $100K Mistake
Before we touch formulas, let's clear up the single most common pricing error in distribution. I've seen this mistake cost companies six figures annually.
Markup is a percentage of your cost. Margin is a percentage of your selling price. They sound similar. They produce very different numbers.
Markup: Selling Price = Cost x (1 + Markup %)
Margin: Selling Price = Cost / (1 - Margin %)
Here's where it gets dangerous. Say you want to "make 30% on a product" that costs you $50.
If you apply a 30% markup: $50 x 1.30 = $65.00 — your actual margin is 23.1%, not 30%.
If you target a 30% margin: $50 / 0.70 = $71.43 — that's your true 30% margin price.
The difference is $6.43 per unit. Sell 10,000 units and you've left $64,300 on the table because someone said "30%" without specifying markup or margin. Across a full catalog, this confusion alone accounts for 1-3% of lost margin at many distributors.
| Target | Formula | Cost = $50 | Actual Margin |
|---|---|---|---|
| 30% markup | $50 x 1.30 | $65.00 | 23.1% |
| 30% margin | $50 / 0.70 | $71.43 | 30.0% |
| 40% markup | $50 x 1.40 | $70.00 | 28.6% |
| 40% margin | $50 / 0.60 | $83.33 | 40.0% |
| 50% markup | $50 x 1.50 | $75.00 | 33.3% |
| 50% margin | $50 / 0.50 | $100.00 | 50.0% |
If your ERP or pricing spreadsheet uses "markup" but your finance team reports "margin," you've got a gap baked into every price. Fixing this alignment is often the single highest-ROI pricing action a company can take.
The Core Pricing Formulas
Cost-Plus Pricing Formula
Cost-plus pricing calculates total cost and adds a fixed percentage. It's the most widely used method in distribution and manufacturing — and for good reason. It's simple, repeatable, and keeps you from selling below cost.
Selling Price = Total Cost per Unit x (1 + Markup %)
-- or, to hit a target margin --
Selling Price = Total Cost per Unit / (1 - Target Margin %)
Example: A manufacturer's total cost for a hydraulic fitting is $22 (materials $14, labor $4, overhead $4). They want a 35% gross margin.
Selling Price = $22 / (1 - 0.35) = $22 / 0.65 = $33.85
Gross Margin = ($33.85 - $22) / $33.85 = 35%
When cost-plus works: Commodity products with low differentiation. Pass-through cost increases during inflationary periods. Categories where you lack competitive or value data.
When cost-plus fails: It treats every product the same. A 35% margin on a $2 commodity fastener might be aggressive — your customer will switch suppliers over a nickel. That same 35% on a $200 specialty valve leaves real money on the table because the customer would've paid $250 without blinking.
According to Simon-Kucher's Global Pricing Study 2025, which surveyed over 2,200 business leaders across 28 countries, only about 24% of companies determine prices using a sophisticated value-based assessment for each market segment — meaning the vast majority still rely heavily on cost-plus with competitive or value-based adjustments layered on top.
Competitive Pricing Formula
Competitive pricing positions your price relative to the market. There isn't a single formula — it's a framework.
Competitive Price = Market Reference Price x Position Factor
Position Factor: Below market (0.90-0.99), At market (1.00), Above market (1.01-1.15)
Example: The market price for a standard 1/2" ball valve is $45. You want to price 5% below market to drive volume.
Competitive Price = $45 x 0.95 = $42.75
The hard part isn't the math. It's getting reliable competitive data. Most distributors rely on anecdotes from sales reps — "the customer said competitor X quoted $40." That's not competitive intelligence. That's negotiation leverage from your buyer. Real competitive pricing requires systematic market data, not war stories from the field.
Value-Based Pricing Formula
Value-based pricing sets the price based on economic value to the customer, not your cost. It's the most profitable approach and the hardest to execute.
Value-Based Price Ceiling = Next-Best Alternative Cost + Switching Costs + Quantifiable Value Differential
Example: You sell a specialty lubricant for $85 per unit. Your cost is $30. The competing product costs $55 but requires twice the application frequency, adding $40 in labor per cycle. The customer's total cost with the alternative is $95 per cycle.
Value Ceiling = $55 + $0 switching + $40 labor savings = $95
Your current price: $85 (leaves $10 of value share with the customer)
Cost floor: $30
Value range: $30 to $95
At $85, you're capturing 82% of the value differential. That's healthy — customers need to see savings to justify switching. But if you'd priced at cost-plus-35% ($30 / 0.65 = $46.15), you'd be leaving $38.85 per unit on the table.
Value-based pricing isn't abstract theory. It's arithmetic — once you know your customer's total cost of alternatives.
Choosing the Right Strategy for Each Product Category
No single pricing method works across an entire catalog. The practical approach is to segment your products and apply the right strategy to each group.
| Product Type | Primary Method | Typical Margin | Example |
|---|---|---|---|
| Commodities (fasteners, wire, fittings) | Cost-plus + competitive | 15-22% | Standard 3/4" copper elbow |
| Standard products (motors, pumps, valves) | Blended | 22-30% | 2HP electric motor |
| Specialty / technical items | Value-based | 28-40% | Custom-spec hydraulic assembly |
| Value-added services (kitting, assembly, technical support) | Value-based | 35-50%+ | Pre-assembled piping kit |
| MRO / emergency orders | Premium pricing | 40-60%+ | Same-day replacement bearing |
This segmentation is what separates companies that "do pricing" from companies that have a pricing strategy. A $75M distributor I've seen applied flat 28% markup across all categories. After segmenting and adjusting, they recovered 3.2% of revenue as additional margin — roughly $2.4M — without losing a single customer.
For more on how this plays out in practice, see B2B Pricing Strategy.
The Step-by-Step Process for Pricing a Product
Here's the sequence that works whether you're pricing a single new SKU or re-pricing your entire catalog.
Step 1: Calculate Your Fully Loaded Cost
Don't start with just the purchase price or BOM. Build the complete cost picture.
Fully Loaded Cost = Direct Materials + Direct Labor + Manufacturing Overhead + Inbound Freight + Warehousing Allocation + Handling Cost
Common cost leaks people miss:
- Inbound freight (especially with tariff surcharges — a real issue in 2026 as new duties hit steel, aluminum, and electronic components)
- Warehousing allocation for slow-moving inventory
- Returns processing costs
- Quality inspection labor
- Payment processing fees
A building products distributor discovered their "true" cost on imported fittings was 12% higher than their ERP showed — because inbound freight, customs duties, and warehouse handling weren't allocated to the SKU level. They'd been pricing off incomplete costs for years.
Step 2: Set Your Margin Floor
Your margin floor is the minimum acceptable gross margin for the product category. Below this number, you don't sell — or you need VP-level approval.
| Category | Margin Floor | Rationale |
|---|---|---|
| A-items (top 20% by velocity) | 18% | Competitive, price-sensitive |
| B-items (middle 50%) | 25% | Balanced |
| C-items (bottom 30% by velocity) | 32% | Low volume, higher cost-to-serve |
| Tail items (< 10 units/year) | 40% | High handling cost relative to value |
The counterintuitive insight: your lowest-volume products should carry your highest margins. They're expensive to stock, pick, and ship relative to their value. And customers buying obscure items rarely price-shop because alternatives are limited.
Step 3: Check the Competitive Landscape
For your top 200-500 SKUs by revenue, you should know the market price. For the rest, category-level benchmarks are sufficient.
Sources of competitive data:
- Published price lists from competitors
- Customer feedback (filtered for negotiation bias)
- Industry pricing databases
- Win/loss analysis on quotes
- Online marketplace pricing for applicable categories
Step 4: Assess Customer Value
For differentiated products and services, answer three questions:
- What's the customer's next-best alternative?
- What does switching cost them (time, risk, requalification)?
- What quantifiable benefit do you deliver beyond the alternative (downtime reduction, labor savings, yield improvement)?
If you can put dollar signs on those answers, you can price to value. If you can't, default to cost-plus with competitive validation.
Step 5: Set the Price and Validate
Combine your inputs:
Price Floor = Fully Loaded Cost / (1 - Minimum Margin %)
Price Ceiling = Value-Based Maximum (or Competitive Maximum)
Target Price = Floor + (Ceiling - Floor) x Capture Rate
Typical Capture Rate: 50-70% of the value gap
Then validate: Does this price make sense for the customer segment? Is it consistent with similar products in the catalog? Will your sales team actually hold it?
That last question matters more than most companies admit. A price that's technically correct but impossible to defend in a sales conversation isn't a real price. It's a starting point for negotiation.
Step 6: Monitor and Adjust
Pricing isn't a set-it-and-forget-it exercise. Track these metrics monthly:
- Realized margin vs. target margin — Are discounts eating your strategy?
- Quote-to-order ratio — Are you pricing yourself out of deals?
- Price exception frequency — How often do reps override the system?
- Pocket price vs. invoice price — What's happening after the invoice?
If your realized margin consistently trails your target by more than 2 points, you don't have a pricing problem. You have a discounting problem. That's a sales management issue, not a pricing formula issue.
Where Product Pricing Actually Breaks Down
The formulas above work in a spreadsheet. In the real world, pricing breaks down in the space between "list price" and "what we actually collect." That space is called the price waterfall, and it's where most margin disappears.
A typical waterfall for a distribution company:
| Stage | Deduction | Running Price |
|---|---|---|
| List price | — | $100.00 |
| Volume discount (8%) | -$8.00 | $92.00 |
| Contract pricing (5%) | -$4.60 | $87.40 |
| Competitive match (3%) | -$2.62 | $84.78 |
| Invoice price | $84.78 | |
| Early-pay discount 2/10 net 30 | -$1.70 | $83.08 |
| Free freight | -$3.50 | $79.58 |
| Returns allowance (1.5%) | -$1.19 | $78.39 |
| Pocket price | $78.39 |
That's a 21.6% gap between list and pocket. Most companies track margin at the invoice level — $84.78, a 15.2% discount from list. But the real number is $78.39, nearly 22% off list. That hidden 6.4 points, multiplied across your entire revenue base, is where the money goes.
McKinsey's foundational 1992 Harvard Business Review article "Managing Price, Gaining Profit" by Michael Marn and Robert Rosiello found that many manufacturers' transaction prices range over 60% from list to pocket, with B2B companies routinely losing 15-40% between list price and pocket price. Even companies that think they've "got pricing handled" are shocked when they build their first complete waterfall.
For a detailed walkthrough, see margin leakage in distribution.
Pricing Mistakes That Cost Mid-Market Companies Millions
Mistake #1: Peanut Butter Pricing
Applying the same markup to every product and every customer. A flat 28% markup across 20,000 SKUs means you're overpriced on commodities (where customers switch for 2%) and underpriced on specialty items (where they'd pay 15% more). SPARXiQ's distribution pricing research, led by CEO David Bauders, shows that the average wholesale distributor has 2-4% of additional profit that could be captured through more robust pricing, representing hundreds of basis points in recoverable margin for most mid-market distributors.
Mistake #2: Letting Sales Reps Set Prices
If your sales team has unlimited discount authority, your pricing strategy doesn't exist. It's a suggestion. The best pricing organizations give reps a range — say, 5% below target — and require approval for anything deeper. This doesn't slow deals. It creates accountability.
Mistake #3: Annual Price Reviews
Reviewing prices once a year worked when input costs were stable. It doesn't work when steel tariffs change in March, resin prices spike in June, and freight rates shift quarterly. Between 2022 and 2025, manufacturers that stuck to annual pricing cycles lost an average of 1.5-3% margin versus those that adjusted quarterly or more frequently.
Mistake #4: Ignoring Cost-to-Serve
Two customers buying the same product at the same price can have wildly different profitability. Customer A orders in full pallets, pays in 15 days, and never returns anything. Customer B orders single units, demands free overnight shipping, pays at 60 days, and returns 8% of orders. Same revenue, completely different margin.
Pricing without accounting for cost-to-serve is pricing with one eye closed.
Mistake #5: Confusing Markup and Margin
We covered this above, but it bears repeating. A 40% markup gives you a 28.6% margin. A 40% margin requires a 66.7% markup. If your pricing team says "40%" and doesn't specify which, your prices are wrong across the board.
How to Price Products When Costs Are Volatile
Tariffs, supply chain disruptions, and raw material volatility have made static pricing dangerous. In 2026, with new duties on steel, aluminum, and electronic components reshaping landed costs, the companies that adjust fastest win.
Three approaches that work:
Index-based pricing: Tie your selling price to a published index (steel, copper, resin). When the index moves, your price moves automatically. This is common in metals distribution and works well for cost-volatile commodities.
Indexed Price = Base Price x (Current Index Value / Base Index Value)
Example: $50 base price x ($1,450 steel index / $1,200 base index) = $60.42
Cost-plus with automatic triggers: Set thresholds that trigger repricing. If input costs move more than 3% in a 30-day window, recalculate. This works for companies that can't index to a published commodity but need more agility than annual reviews.
Surcharge models: Add a line-item surcharge for volatile cost components (fuel, raw materials, tariffs). Customers see the base price as stable and the surcharge as a pass-through. This protects margins without triggering the "you raised prices again" conversation.
Bringing It All Together: A Pricing Diagnostic
If you're managing thousands of SKUs in a spreadsheet and you're not sure where margin is leaking, start with a diagnostic. Not a 6-month consulting engagement. Not a $100K software implementation. A focused analysis of your transaction data that answers three questions:
- Where is my actual margin vs. my intended margin? Build a price waterfall for your top 100 customers.
- Which products are mispriced? Compare realized margin by category against your targets.
- How much money is on the table? Quantify the dollar opportunity from closing the gap.
That's what Pryse is built for. Upload your transaction data, get a price waterfall visualization, and see exactly where margin is disappearing — in 24 hours, not 6 months. It's a $1,499 diagnostic that typically uncovers 10-50x its cost in recoverable margin.
Because the hardest part of pricing products isn't the formula. It's seeing what's actually happening in your data.
For the full strategic framework, start with our Pricing Strategy Guide. For real-world examples of these strategies in action, see Pricing Strategy Examples and B2B Pricing Strategy.
Last updated: Invalid Date
Frequently Asked Questions

Want to analyze your entire product catalog?
Pryse automatically identifies margin leakage across thousands of SKUs. Upload your data and find hidden profit in 24 hours.
One-time $1,499 diagnostic. No subscription required.