Pricing Strategy Types: Which Ones Actually Work for Distributors and Manufacturers
A breakdown of 9 pricing strategy types used in distribution and manufacturing, with formulas, margin benchmarks, and guidance on which to use when.
A pricing strategy type is the underlying logic a company uses to set prices. Cost-plus starts from what something costs you. Value-based starts from what it's worth to the customer. Competitive starts from what others charge. Each produces a different number for the same product, and picking the wrong one for the wrong product category is how distributors and manufacturers bleed margin without realizing it.
Here's the problem most mid-market companies run into: they don't choose a pricing strategy. They inherit one. Somebody set up cost-plus markups in the ERP eight years ago, and those percentages have been copy-pasted into every new product category since. The catalog grew from 3,000 SKUs to 15,000, the customer base shifted, raw material costs swung wildly during 2022-2024, and the markups stayed the same.
That's not a strategy. It's inertia. And according to McKinsey's 2003 article "The Power of Pricing" (McKinsey Quarterly), fixing it can be worth an 8% increase in operating profit for every 1% improvement in realized price.
This post breaks down the pricing strategy types that matter for distribution and manufacturing, when each one works, when it doesn't, and how to combine them without drowning in complexity. For the full strategic framework, see our Pricing Strategy Guide.
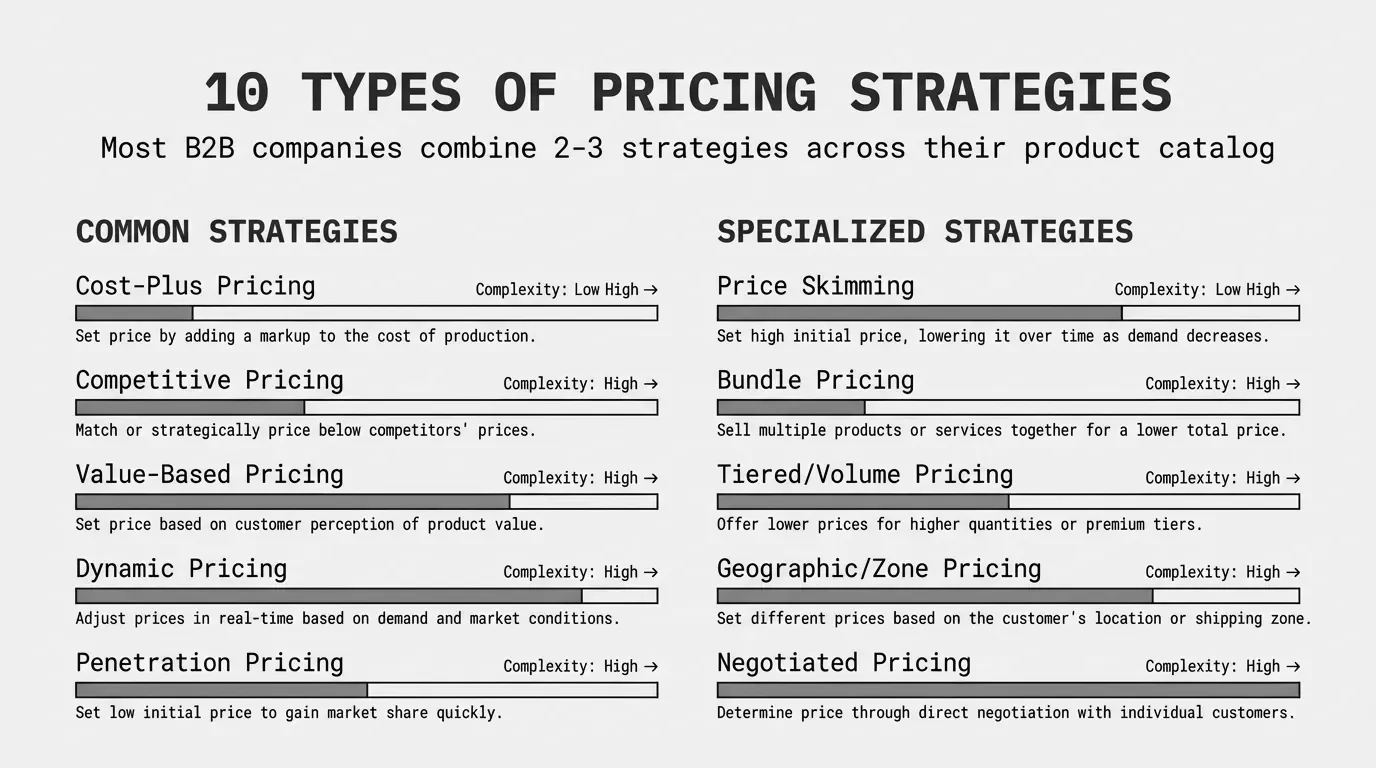
The Three Foundational Pricing Strategy Types
Every pricing approach in B2B distribution and manufacturing traces back to one of three foundations. Think of them as starting points, not final answers.
1. Cost-Plus Pricing
Cost-plus pricing calculates the selling price by adding a fixed percentage markup to the cost of goods. It's the default in distribution and manufacturing because it's simple, defensible, and prevents selling below cost.
Selling Price = Cost of Goods x (1 + Markup %)
Example: $42 cost x (1 + 0.30) = $54.60 selling price
Where it works. Commodity products with thin differentiation. Pass-through cost increases when supplier prices jump. New product lines where you don't have competitive intelligence yet. It's a safe floor.
Where it breaks. Cost-plus treats every dollar of cost the same. A 30% markup on a $3 commodity fitting produces $0.90 in margin. That same 30% on a $300 specialty valve produces $90. But the specialty valve might be worth $500 to a customer facing a production shutdown, and nobody's shopping it against three competitors. You're leaving $110 on the table because you priced to your cost, not their situation.
The Achilles' heel of pure cost-plus: your cost structure doesn't determine your customer's willingness to pay. A distributor running 25% flat markup across 10,000 SKUs is almost certainly underpricing specialty items and overpricing commodities.
2. Competitive Pricing
Competitive pricing sets your price relative to what other suppliers charge for comparable products. You position above, at, or below market depending on your service level and differentiation.
Where it works. High-transparency categories where customers actively compare. Online channels. Commodity products where switching costs are near zero. Markets with published price lists or well-known benchmarks.
Where it breaks. Most distributors don't actually have reliable competitive data. What they have is anecdotes from sales reps: "the customer says ABC Distributing is 10% cheaper." That's not competitive intelligence. That's a negotiation tactic from a buyer who knows your rep is compensated on revenue, not margin.
Simon-Kucher's 2023 Global Pricing Study found that only 65% of companies worldwide truly possess pricing power, and warns that over-indexing on competitor prices triggers price wars where everyone's profitability suffers. In distribution, competing on availability, technical support, and reliability is almost always more sustainable than competing on price alone.
3. Value-Based Pricing
Value-based pricing sets the price based on the quantifiable economic benefit a product delivers to the customer, not what it costs to produce or what competitors charge.
Value-Based Price Ceiling = Next Best Alternative Cost + Switching Costs + Value Differential
Example: $35 alternative + $15 switching cost + $40 labor savings = $90 ceiling
Where it works. Specialty and engineered products. Value-added services like kitting, assembly, or technical support. Situations where you solve a specific, measurable problem: reduced downtime, lower scrap rates, faster installation.
Where it breaks. Commodity products where the customer has five interchangeable options. Standard items with no service wrapper. Any situation where your product is genuinely identical to cheaper alternatives.
Here's a real-world example. A manufacturer sells a specialty gasket for $28. Cost is $11, so they're happy with the 60% gross margin. But the next-best alternative is a $19 generic gasket that fails 3x more often, causing $180 per failure in line stoppage. Over 100 uses, the specialty gasket saves the customer roughly $320 in avoided downtime. That $28 price could be $40 and still deliver compelling ROI. The manufacturer left $1,200 per 100 units on the table by pricing to cost instead of value.
For more on negotiated pricing in value-based scenarios, see our dedicated guide.
Six More Pricing Strategy Types Used in Distribution and Manufacturing
Beyond the big three, several other strategy types show up in specific situations. Don't treat these as standalone approaches. They're tactical tools that layer on top of your foundational strategy.
4. Volume / Tiered Pricing
Volume pricing offers progressive discounts as purchase quantities increase. It's the backbone of wholesale and distribution economics.
Effective Unit Price = Base Price x (1 - Tier Discount %)
Example: $50 base x (1 - 0.12) = $44 per unit at Tier 3
A well-structured tier system might look like this:
| Order Quantity | Discount | Effective Price (on $50 item) |
|---|---|---|
| 1-99 units | 0% | $50.00 |
| 100-499 units | 5% | $47.50 |
| 500-999 units | 10% | $45.00 |
| 1,000+ units | 15% | $42.50 |
The trap: most distributors set tier thresholds too low. If 80% of your customers already hit the top discount tier without stretching, you're not incentivizing larger orders. You're just reducing price. Audit your tier structures annually. Make the top tier require genuine incremental volume.
For a deeper look at structuring tiers, see our post on B2B tiered pricing.
5. Dynamic Pricing
Dynamic pricing adjusts prices based on real-time market conditions: demand fluctuations, inventory levels, raw material cost swings, and competitive moves.
In distribution and manufacturing, this applies most to:
- Commodity products with volatile input costs (steel, copper, lumber, chemicals)
- Seasonal products where demand is predictable but concentrated
- Excess inventory that needs to move before it becomes obsolete
Dynamic pricing doesn't mean changing prices every hour like an airline. For most distributors, it means updating cost-sensitive items weekly or monthly instead of annually. During the 2022-2024 inflation cycle, manufacturers that adjusted prices quarterly instead of annually captured 3-7% more margin than those that stuck to traditional annual increases.
6. Penetration Pricing
Penetration pricing sets prices deliberately low to enter a new market or capture share in an existing one. The plan is to raise prices later once you've established volume and customer relationships.
When it makes sense: Entering a new geography. Launching a private-label product to compete with established brands. Breaking into a new customer segment where you have no track record.
The risk: In B2B, customers have long memories. The "low introductory price" becomes the anchor. When you try to raise prices to sustainable levels, you face pushback, and sometimes defection. Use penetration pricing with explicit time limits and written communication that the pricing is promotional.
7. Geographic Pricing
Geographic pricing adjusts for regional cost differences: freight, warehousing, local market conditions, and competitor density.
A distributor with warehouses in three regions might charge 4-8% more for deliveries to remote areas where freight costs are higher. Steel distributors commonly use geographic pricing to account for shipping weight and distance. The key is making the adjustments reflect actual cost-to-serve differences, not arbitrary regional markups.
8. Bundle Pricing
Bundle pricing combines related products at a discount compared to buying each separately. In distribution, this often takes the form of kits, project packages, or maintenance bundles.
Bundle Discount = (Sum of Individual Prices - Bundle Price) / Sum of Individual Prices x 100
Example: ($120 individual - $99 bundle) / $120 = 17.5% bundle discount
Bundling works when the components are genuinely complementary and the bundle encourages customers to buy items they might not have purchased individually. A fastener distributor bundling screws, washers, and anchors for a specific application type creates convenience that justifies a modest discount while increasing average order value.
9. Economy Pricing
Economy pricing sets prices as low as possible to move maximum volume with minimal margin per unit. Revenue comes from volume, not markup.
This strategy requires extremely low overhead and operational efficiency. It's rare in mid-market distribution because the cost-to-serve on small orders, picking, packing, shipping, customer service, eats into the thin margins. Economy pricing tends to work only for distributors with highly automated operations or those selling through low-touch digital channels.
How to Match Strategy Types to Your Catalog
The single biggest mistake mid-market companies make isn't choosing the wrong strategy. It's applying one strategy to everything. SPARXiQ CEO David Bauders calls this "peanut butter pricing" -- spreading the same markup evenly across the entire catalog like peanut butter on toast. SPARXiQ's research across over 500 distributors found it leaves 200 to 400 basis points of profit uncaptured.
Here's a practical framework for matching pricing strategy types to product segments:
| Product Category | Primary Strategy | Secondary Strategy | Typical Gross Margin |
|---|---|---|---|
| Commodities (fasteners, wire, pipe) | Competitive | Cost-plus floor | 15-22% |
| Standard products (motors, pumps, valves) | Cost-plus | Competitive reference | 22-30% |
| Specialty / engineered items | Value-based | Cost-plus floor | 28-45% |
| Private label / exclusive products | Value-based | Market testing | 30-50% |
| Maintenance / MRO consumables | Volume tiered | Competitive | 20-28% |
| Value-added services (kitting, assembly) | Value-based | Bundled | 35-55% |
This segmentation doesn't need to be perfect. Even a rough split into three tiers, commodity, standard, and specialty, with different margin targets for each, outperforms a flat markup across the board. The point is intentionality.
For a detailed walkthrough of building this segmentation, see our B2B pricing strategy guide.
The Customer Dimension: Same Product, Different Strategy
Product segmentation is half the picture. The same product might warrant different pricing for different customer types.
A 500-unit order from a strategic account that buys $2M annually deserves different treatment than a 500-unit order from a one-time buyer you'll never see again. That's not favoritism. It's economics. The strategic account's lifetime value, predictable ordering patterns, and low cost-to-serve justify tighter margins. The one-time buyer gets standard pricing because there's no long-term value to offset a discount.
Build a simple customer segmentation:
- Strategic accounts (top 10-15% by revenue with growth potential): Tighter margins, negotiated contracts, volume incentives
- Core accounts (steady, reliable, moderate volume): Target margins, standard terms, earned discounts
- Transactional accounts (low volume, unpredictable, high cost-to-serve): Full margin, no special accommodations
Cross this with your product segmentation and you get a pricing matrix. A strategic customer buying commodity items gets competitive pricing. A transactional customer buying specialty items pays full value-based pricing. Each cell has a margin target and a strategy that makes economic sense.
Common Pitfalls When Combining Pricing Strategy Types
Mixing strategies sounds straightforward. In practice, a few things tend to go wrong.
Discount stacking. A customer qualifies for a volume discount, a contract discount, and a promotional discount simultaneously. Each made sense in isolation. Together, they compress your margin below the cost-plus floor. Build guardrails that cap total discount depth regardless of how many individual discounts apply.
Strategy drift. You launch with segmented pricing, but over 18 months, sales reps gradually extend "strategic account" pricing to core and transactional customers. Without regular audits, your carefully designed matrix dissolves into the same flat pricing you started with.
Ignoring cost-to-serve. Two customers order the same $10,000 of product monthly. One places a single PO, pays on time, and picks up at your warehouse. The other places 15 small orders, demands next-day delivery, calls your technical team weekly, and pays at net-60. Same revenue. Radically different profitability. Your pricing strategy needs to reflect that gap, either through pricing differentials or minimum order thresholds.
Overcomplicating the tail. The bottom 50% of your SKUs typically represent less than 5% of revenue. Don't spend weeks agonizing over competitive pricing for items you sell 12 units of per year. Slap healthy margins on the long tail and focus your analytical effort on the A and B items that actually move the needle.
Measuring Whether Your Strategy Mix Is Working
You don't need enterprise pricing software to track the basics. Monitor these five metrics quarterly:
-
Gross margin by product segment. Is each tier hitting its target? If specialty items are earning commodity-level margins, your value-based pricing isn't holding.
-
Pocket margin vs. invoice margin. The gap between these two numbers represents your off-invoice leakage: freight, payment terms, returns, rebates. If the gap is widening, your strategy is being undermined by operational concessions.
-
Discount override rate. What percentage of transactions involve a sales rep overriding the system price? Healthy companies keep this under 15-20%. Above 30%, your pricing strategy exists only on paper.
-
Win rate by margin band. Are you winning deals only when you discount heavily? Or are you winning at target margins too? If your win rate drops to near-zero above 25% margin, you may have a competitive positioning problem, not a pricing problem.
-
Revenue mix shift. Track what percentage of revenue comes from each product segment over time. If your commodity mix is growing while specialty is shrinking, your overall margins will compress even if each segment's pricing is perfect.
For a hands-on example of tracking these metrics, see our margin analysis example walkthrough.
Getting Started: From Flat Markup to Segmented Pricing
If you're currently running a flat cost-plus markup across your catalog, here's a pragmatic path forward. You don't need to boil the ocean.
Week 1. Export 12 months of transaction data. Calculate actual realized margin, not list margin, by product category and customer. Most ERPs can produce this report, even if nobody's run it before.
Week 2. Segment your products into three tiers: commodity, standard, specialty. You don't need a PhD in pricing science. If your sales team can tell you which items customers price-shop and which ones they don't, that's enough to start.
Week 3. Set differentiated margin targets. Even modest differentiation helps. If you're currently at 25% flat, try 20% for commodities, 27% for standard, and 33% for specialty. Run the math on what that shift does to your total gross profit.
Week 4. Identify your top 10 margin leakage sources. These are usually buried in off-invoice adjustments: free freight on small orders, stale promotional pricing that nobody turned off, payment term discounts that don't reflect current interest rates.
Ongoing. Quarterly reviews. Monthly reporting. Incremental refinement. The companies that see the biggest improvements aren't the ones that build the most sophisticated models. They're the ones that start measuring the gap between list price and pocket price and then systematically close it.
Pryse builds that visibility from a CSV upload in 24 hours. Upload your transaction data, get a price waterfall analysis, and see exactly where each pricing strategy type is working and where it's leaking margin. No six-month implementation. No $100K software contract.
For the complete pricing strategy framework, see our Pricing Strategy Guide.
Last updated: Invalid Date
Frequently Asked Questions

Want to analyze your entire product catalog?
Pryse automatically identifies margin leakage across thousands of SKUs. Upload your data and find hidden profit in 24 hours.
One-time $1,499 diagnostic. No subscription required.