How to Write a Pricing Strategy for Your Business Plan
Step-by-step guide to writing the pricing strategy section of your business plan. Covers cost analysis, margin targets, and financial projections for distribution and manufacturing.
A pricing strategy in a business plan is the section that explains exactly how you'll set prices, why those prices make sense, and how they connect to profitability. It's not a paragraph that says "we'll use competitive pricing." It's a data-backed argument that your prices will generate the margins your financial projections promise.
Most business plans treat pricing as an afterthought. A sentence or two buried in the marketing section. Maybe a line about "competitive rates" or "value-based pricing." That's a problem, because pricing is the single highest-leverage variable in your entire financial model. McKinsey's 2003 article "The Power of Pricing" shows that a 1% improvement in realized price drives an 8% increase in operating profit for the average S&P 1500 company. No other lever comes close. Not volume growth, not cost reduction.
If you're building a business plan for a distribution or manufacturing company, your pricing section needs to do real work. Here's how to write one that holds up to scrutiny from investors, lenders, and your own operations team.
For the broader framework on pricing approaches, see our complete Pricing Strategy Guide.
Why the Pricing Section Matters More Than You Think
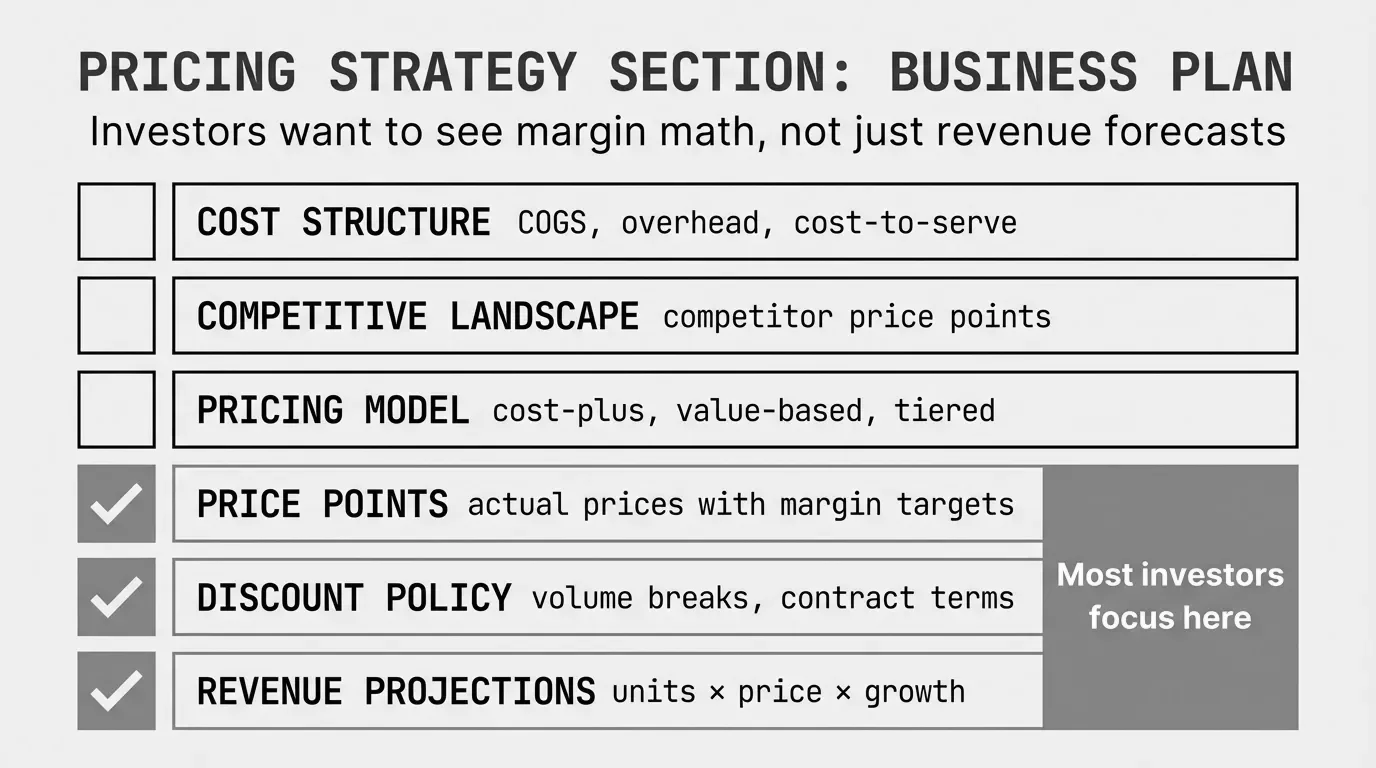
Investors and lenders read business plans backwards. They start with the financials, then ask "where did these numbers come from?" Your revenue projections are price times volume. If you can't defend the price assumption, your entire financial model falls apart.
Here's what that looks like in practice:
Projected Revenue = Average Selling Price x Unit Volume x Product Mix
Projected Gross Profit = Projected Revenue x Target Gross Margin %
Example: $65 avg price x 200,000 units x 1.0 = $13M revenue at 28% margin = $3.64M gross profit
Change the average selling price by 5% in either direction and your gross profit swings by $650K. That's the difference between a business that funds its own growth and one that needs another capital raise.
For mid-market distributors and manufacturers, the stakes are even higher. You're managing thousands of SKUs across hundreds of customers. A flat markup doesn't cut it. Your business plan needs to show that you understand the pricing complexity inherent in your business and have a plan to manage it.
The Seven Components of a Business Plan Pricing Strategy
Every credible pricing section needs these seven elements. Skip one and you'll get questions you can't answer.
1. Cost Structure and Pricing Floor
Start with what it actually costs you to deliver your product. This isn't just COGS. It's the fully loaded cost that represents your absolute minimum viable price.
Pricing Floor = COGS + Freight + Warehousing + Handling + Returns Allowance
Example: $40 COGS + $3.50 freight + $2.10 warehousing + $0.80 handling + $0.60 returns = $47.00 floor
A $50M distributor carrying 15,000 SKUs will have wildly different cost structures across product categories. A 50-pound motor has different freight economics than a bag of cable ties. Your business plan should acknowledge this variation and show how you've accounted for it.
The mistake most plans make: calculating COGS and stopping there. Off-invoice costs like freight, payment term discounts, and returns typically add 7-15% on top of product cost. If your pricing floor doesn't include these, your margin projections are fiction.
For more on where these hidden costs accumulate, see our breakdown of margin leakage in distribution.
2. Competitive Benchmarking
You need to show that your prices exist in a market context, not a vacuum. This means identifying:
- Direct competitors and their approximate pricing on comparable products
- Your positioning relative to those competitors (premium, parity, or below market)
- The justification for that positioning
Here's the thing most business plans get wrong: they claim competitive pricing without any actual competitive data. "Our prices will be competitive" means nothing. "We've benchmarked 200 of our top-moving SKUs against three regional competitors and found our average invoice price sits 3% above market on A-items, at parity on B-items, and 12% above on C-items" means something.
For distributors, competitive data on the top 20% of SKUs by revenue usually covers 80% of what customers actually price-shop. The long tail of specialty items? Those rarely get compared. That's where your margin opportunity lives.
3. Pricing Model Selection
Your business plan should specify which pricing model or combination you'll use, and explain why it fits your business.
| Pricing Model | Best For | Typical Gross Margin | Risk |
|---|---|---|---|
| Cost-plus | Commodity products, pass-through pricing | 18-25% | Leaves money on specialty items |
| Competition-based | High-transparency markets, online channels | 20-28% | Race to the bottom without guardrails |
| Value-based | Differentiated products, technical services | 28-45% | Requires deep customer knowledge |
| Tiered/volume | Large accounts, growth incentives | 15-35% (varies by tier) | Can compress margin if tiers are too easy to reach |
Most distribution and manufacturing companies should present a blended approach. Pure cost-plus leaves money on the table. Pure value-based is hard to execute across 10,000+ SKUs. The blend is what works. Use cost-plus as the floor, competitive data as the reference, and value-based adjustments where you have genuine differentiation.
Our B2B pricing strategy post goes deeper into how these models work together in practice.
4. Customer and Product Segmentation
A flat markup is the fastest way to signal that you haven't thought seriously about pricing. Your business plan should show how prices vary across segments.
Product segmentation by pricing sensitivity:
- A items (top 20% by revenue): Competitively shopped. Price tight to market. These are your visible items that customers compare.
- B items (middle 30%): Moderate sensitivity. Room for margin improvement without losing volume.
- C items (bottom 50%): Rarely compared. Highest margin opportunity. Nobody price-shops a $3 specialty fitting.
Customer segmentation by value:
- Strategic accounts (high volume, growth potential): Sharper pricing, better terms, long-term relationship value.
- Core accounts (steady, reliable): Standard margins, standard terms.
- Transactional accounts (low volume, high cost-to-serve): Premium pricing or improve-and-exit.
The intersection creates your pricing matrix. A strategic customer buying A items gets your tightest price. A transactional customer buying C items gets full margin. This isn't complicated. But most business plans don't show it. And the ones that do get taken more seriously by anyone reading the financials.
For a worked example of this segmentation in action, see B2B tiered pricing.
5. Margin Targets by Segment
Translate your segmentation into specific numbers. This is where your pricing strategy connects to your financial projections.
| Segment | A Products | B Products | C Products |
|---|---|---|---|
| Strategic customers | 18-22% | 24-28% | 28-34% |
| Core customers | 22-26% | 28-32% | 32-38% |
| Transactional customers | 26-30% | 32-36% | 36-42% |
These aren't aspirational goals. They're the guardrails your sales team will operate within. When a rep asks "can I discount this?" the answer comes from the matrix, not from a gut feeling.
Blended Target Margin = Sum of (Segment Revenue % x Segment Target Margin %)
Example: (40% of revenue at 22%) + (35% at 30%) + (25% at 36%) = 8.8% + 10.5% + 9.0% = 28.3% blended
That blended number is what drives your gross profit line in the financial projections. Show the math. Investors appreciate it.
6. Discount Governance
This is the section most business plans leave out entirely, and it's the one that matters most for execution. You can set perfect margin targets. If your sales team discounts without guardrails, those targets are meaningless.
Your pricing strategy should address:
- Discount authority levels. Reps can discount 3% at their discretion, 3-7% needs a manager, 7%+ needs VP approval.
- Deal scoring criteria. Factor margin into win/loss decisions, not just revenue.
- Exception tracking. How you'll monitor and review price overrides.
- Incentive alignment. Sales compensation that rewards margin, not just top-line revenue.
Bain & Company's 2018 pricing capabilities survey of 1,700 B2B companies, published in Harvard Business Review, emphasizes that sales team alignment is where most pricing strategies break down. You can have a brilliant pricing model. If reps have unlimited discount authority and revenue-only compensation, your realized prices will drift below target within months.
For more on protecting margin through governance, see our guide on how to fix margin leakage.
7. Financial Impact Analysis
This is the bridge between your pricing strategy and your financial projections. Show explicitly how your pricing assumptions flow through to the P&L.
Annual Gross Profit Impact of 1% Price Change = Total Revenue x 1%
Operating Profit Impact = Revenue x 1% x (1 / Operating Margin %)
Example: $50M revenue x 1% = $500K gross / 5% operating margin = 10M / ... simplified: $500K flows straight to operating profit
More practically, your financial impact section should include:
- Revenue sensitivity to price changes (what happens if average realized price is 2% below plan?)
- Break-even pricing by product category
- Margin improvement roadmap showing how you'll move from current to target margins over 12-24 months
- Pricing risk factors like tariff exposure, commodity cost volatility, or competitive price wars
A 2025 Harvard Business School study by Alberto Cavallo, Paola Llamas, and Franco Vazquez, "Tracking the Short-Run Price Impact of U.S. Tariffs," found that tariff increases pushed retail prices of imported goods up 5.4% compared to pre-tariff trends, with domestic goods in import-intensive sectors rising about 3%. If your business touches imported materials or components, your pricing strategy needs to address how you'll handle cost pass-through without destroying competitiveness.
How to Present the Pricing Strategy Section
Format matters. A wall of text about pricing theory doesn't land the way a structured, data-backed section does.
Lead with your pricing model and rationale. Two to three paragraphs on the approach and why it fits your market.
Show the numbers in tables. Margin targets by segment, competitive benchmarks, cost structures. Tables are scannable and credible.
Connect pricing to financial projections. Explicitly reference the pricing assumptions in your revenue model. "Our year-one revenue projection of $12.5M assumes an average realized gross margin of 27.8%, based on the segmented margin targets detailed above."
Address risks. What happens if a major competitor drops prices 10%? What if input costs spike? How quickly can you adjust? Showing you've considered the downside makes the upside projections more believable.
Keep it concise. The pricing section of a business plan should be 2-4 pages. Detailed enough to be credible, brief enough to keep attention. Save the granular analysis for an appendix if needed.
Common Pricing Strategy Mistakes in Business Plans
I've reviewed hundreds of business plans from distribution and manufacturing companies. These mistakes show up repeatedly.
The "competitive pricing" handwave. Stating you'll offer competitive prices without any competitive data to support it. If you haven't benchmarked, you're guessing.
Ignoring cost-to-serve variation. A $200 order shipped overnight to a rural address costs you fundamentally more than a $5,000 order picked up at your warehouse. If your pricing strategy doesn't account for cost-to-serve, your margin projections on small accounts are overstated.
Single margin assumption across all products. Projecting 25% gross margin across a 10,000-SKU catalog signals that you haven't done the work. Real distributors have items at 12% margin and items at 45% margin. Show the blend.
No pricing governance. A strategy without execution controls is a wish. If you don't address how prices get set, approved, and enforced in daily operations, the plan looks theoretical.
Forgetting off-invoice costs. Your business plan shows 28% gross margin. But after freight absorption, payment term discounts, returns, and rebates, your pocket margin is 21%. If your financial projections use invoice margin instead of pocket margin, they're overstated by 7 points. See our analysis of the pocket price waterfall for why this gap matters.
A Practical Example: $75M Industrial Distributor
Let's walk through what a pricing strategy section looks like for a mid-market industrial distributor with $75M in revenue, 12,000 SKUs, and 400 active customers.
Current state: Flat 26% cost-plus markup across all products. Sales reps discount 5-8% on most quotes with no formal approval process. Realized gross margin: 21.3% (vs. the 26% they think they're earning). No visibility into off-invoice costs.
Proposed pricing model: Blended approach with product-customer segmentation.
Margin targets:
| A Products (2,400 SKUs) | B Products (3,600 SKUs) | C Products (6,000 SKUs) | |
|---|---|---|---|
| Strategic (40 accounts) | 20% | 26% | 30% |
| Core (200 accounts) | 24% | 30% | 35% |
| Transactional (160 accounts) | 28% | 34% | 40% |
Projected impact: Moving from flat 26% markup (21.3% realized) to segmented pricing with discount guardrails targets a blended realized margin of 25.8%. On $75M revenue:
Current pocket margin: $75M x 21.3% = $15.975M gross profit
Target pocket margin: $75M x 25.8% = $19.35M gross profit
Incremental gross profit: $3.375M
That $3.375M doesn't require a single new customer or a single new product. It comes from pricing the existing business correctly.
Implementation timeline: Segmentation and guardrails in month one. Sales team training in month two. First quarterly review in month three. Full margin impact realized by month six.
This kind of concrete, numbers-backed pricing strategy tells investors and lenders that you understand your business at a granular level. It's the difference between "we'll have good margins" and "here's exactly how we'll achieve them."
Getting Your Pricing Data in Shape
You can't write a credible pricing strategy without data. And for most mid-market distributors and manufacturers, that data lives in an ERP system that's hard to extract from, or worse, in spreadsheets that nobody's reconciled in months.
Start with 12 months of transaction data. Calculate realized margin by customer and product category. Build your price waterfall to understand the gap between list price and pocket price. Identify your top margin leakage sources.
If pulling and analyzing that data sounds like a three-month project, it doesn't have to be. Pryse builds a complete pricing diagnostic from a CSV export in 24 hours, identifying exactly where margin is leaking and quantifying the dollar opportunity. No six-month implementation. No $100K software license.
For the full framework on building your pricing strategy, see our Pricing Strategy Guide.
Last updated: Invalid Date
Frequently Asked Questions

Want to analyze your entire product catalog?
Pryse automatically identifies margin leakage across thousands of SKUs. Upload your data and find hidden profit in 24 hours.
One-time $1,499 diagnostic. No subscription required.