Dealer Pricing Strategy: How to Set, Structure, and Protect Dealer Margins
Learn how to build a dealer pricing strategy that protects margins and drives volume. Covers tier structures, discount schedules, MAP policies, and margin leakage prevention.
Dealer pricing is the discounted price a manufacturer or distributor charges authorized resellers who purchase products for resale to end customers. It's the number that sits between your cost of goods and the price the end buyer pays.
Get it wrong and you'll either bleed margin through uncontrolled discounting, or lose dealers to competitors who offer better economics. Get it right and you've built a channel that scales without requiring your own sales team in every market.
I spent four years at McKinsey working with industrial manufacturers on exactly this problem. The pattern was always the same: the company had "dealer pricing" but it was really just a spreadsheet of ad-hoc discounts that nobody could explain. This guide covers how to build a dealer pricing strategy that actually works.
Why Dealer Pricing Strategy Matters for Distributors and Manufacturers
A 1% price reduction leads to roughly an 11% dip in profit for the average company. That stat comes from McKinsey's study of the Global 1200, as cited in Rafi Mohammed's The 1% Windfall (2010). I've seen it play out at three different clients.
Here's what typically happens without a structured dealer pricing strategy:
- Sales reps negotiate one-off discounts that become permanent. A "temporary" 5% accommodation turns into a new baseline.
- Dealers play you against competitors. Without clear tiers, every deal becomes a negotiation where the loudest dealer wins.
- Margin leaks compound silently. Freight absorption, co-op advertising credits, volume rebates that aren't actually earned. These add up to 8-15% of revenue at companies I've audited.
- You can't tell who's profitable. When every dealer has a different price, figuring out which relationships actually make money requires forensic accounting.
The fix isn't complicated. It's just structured. You need clear tiers, documented policies, and a way to measure what's actually happening vs. what you think is happening.
Dealer Pricing vs. Distributor Pricing vs. Wholesale Pricing
Before building your strategy, get the terminology straight. These three terms get used interchangeably, but they're different positions in the supply chain.
| Factor | Distributor Price | Dealer Price | Wholesale Price |
|---|---|---|---|
| Who buys | Buys from manufacturer | Buys from distributor | Buys from manufacturer or distributor |
| Who they sell to | Dealers, retailers, wholesalers | End customers | Retailers, businesses |
| Pricing control | Bound by manufacturer terms | Sets own retail markup | Flexible, sets own prices |
| Typical markup | 20-40% on cost | Varies by end market | 15-25% on cost |
| Typical margin | 3-10% net | 10-25% net | 5-15% net |
Distributor pricing is the lowest price in the chain because distributors take on the most risk: they carry inventory, extend credit, handle logistics, and cover a territory. Dealer pricing sits higher because dealers buy smaller quantities and sell to end users. Wholesale pricing falls somewhere in between depending on the industry.
If you're a manufacturer setting dealer pricing, you're really making a channel pricing decision. The price you give dealers needs to leave room for them to make money while keeping your brand's market positioning intact.
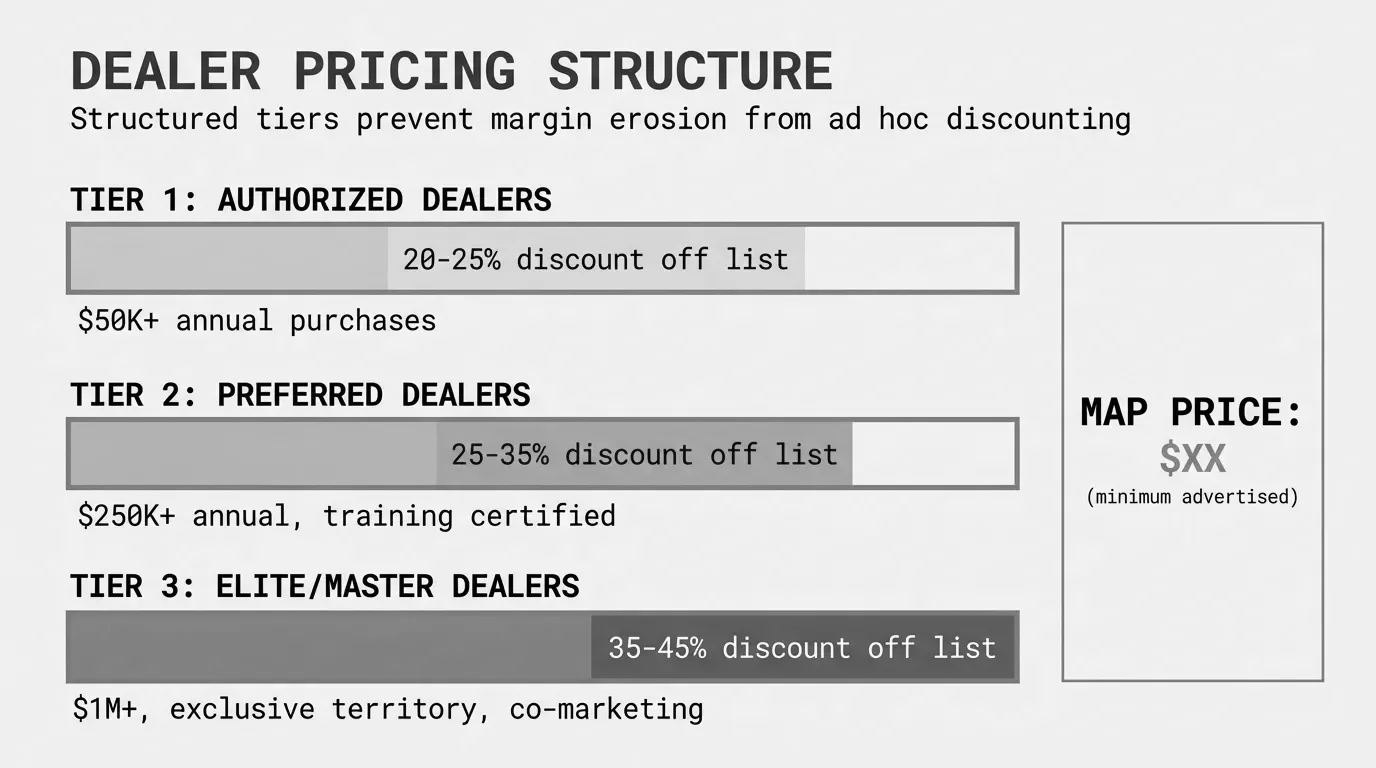
How to Structure Dealer Pricing Tiers
The simplest approach that works is a volume-based tier structure with 3-4 levels. Here's a framework I've used with manufacturing clients doing $30M-$150M in revenue.
The 3-Tier Starter Framework
| Tier | Annual Volume | Discount Off List | Typical Margin for Dealer |
|---|---|---|---|
| Bronze | Under $250K | 20% | 15-20% |
| Silver | $250K - $750K | 25-28% | 20-25% |
| Gold | $750K+ | 30-35% | 25-30% |
A few principles that make this work:
Base tiers on annual commitments, not individual orders. If you discount based on single PO size, you're training dealers to consolidate orders for better pricing without actually buying more. Annual volume commitments create real alignment.
Keep the gap between tiers meaningful but not massive. A 5-8 point spread between tiers is enough to motivate dealers to grow into the next level. A 15-point spread creates a cliff where smaller dealers can't compete with larger ones on the same products.
Add performance requirements at the top tier. Gold-level pricing shouldn't just be about volume. Require things like sales training completion, minimum stocking levels, or co-marketing participation. This separates dealers who are invested in your products from those who just move boxes.
Calculating Your Discount Floor
Before setting any dealer discounts, know your floor. This is the lowest price you can offer and still make money after accounting for all costs.
Discount Floor = ((Selling Price - COGS - Operating Costs - Target Profit) / Selling Price) x 100
Example: Product lists at $100, COGS is $45, operating costs allocated at $15, target profit is $10
Floor = (($100 - $45 - $15 - $10) / $100) x 100 = 30% maximum discount
If your floor is 30%, your Gold tier tops out at 30-32% (leaving slim margin) and your Bronze tier sits at 20%. That gives you room to make money at every tier.
One thing I see constantly: companies set dealer discounts without accounting for all the off-invoice costs. The discount schedule says 25%, but after freight, rebates, co-op credits, and returns, the effective discount is 38%. More on that in the margin leakage section below.
Setting the Right Dealer Discount Schedule
Your discount schedule is the specific document that tells sales reps (and dealers) what price applies in each situation. A good discount schedule covers five things:
1. Base Product Discounts by Category
Not every product line should carry the same discount. High-margin specialty items can support deeper dealer discounts. Commodity items with thin margins need tighter controls.
| Product Category | List Price | Bronze | Silver | Gold |
|---|---|---|---|---|
| Specialty/high-margin | $500 | 22% | 28% | 33% |
| Standard | $200 | 20% | 25% | 30% |
| Commodity/competitive | $50 | 15% | 18% | 22% |
2. Volume Incentive Rebates
Separate your upfront discount from volume rebates. The upfront discount hits every invoice. The rebate is earned quarterly or annually based on actual performance.
This protects you from giving away margin upfront on volume that never materializes. A common structure:
- Hit 80% of annual commitment: 1% rebate on all purchases
- Hit 100%: 2% rebate
- Hit 120%: 3% rebate + early access to new products
3. Promotional and Seasonal Pricing
Define when and how you'll run promotions. Without this, promotional discounts stack on top of dealer discounts and your pocket margin disappears.
Set clear rules: promotional discounts replace the standard dealer discount during the promotion window, they don't add to it. Put this in writing. Sales teams will try to stack them.
4. New Dealer Onboarding Pricing
New dealers need competitive pricing to start, but shouldn't get top-tier discounts before proving themselves. A 90-day introductory rate 2-3 points above Bronze gives them a taste of better economics without giving away the store.
5. Approval Thresholds for Exceptions
Every company needs exception pricing. The question is who can approve it.
- Up to 5% above standard discount: Sales rep authority
- 5-10% above standard: Sales manager approval
- 10%+ above standard: VP or C-level only
Write these down. When a rep tells a dealer "I got you a special deal," someone with P&L responsibility should have signed off.
Protecting Dealer Margins with MAP Policies
A Minimum Advertised Price (MAP) policy is an agreement between you and your dealers that sets the lowest price they can publicly advertise your products. It doesn't control what they charge in a private negotiation or quote. It controls what shows up on their website, in their catalog, and in their ads.
MAP matters because price visibility has exploded. When one dealer posts your $500 product at $299 on their website, every other dealer either matches it or stops carrying your line. You end up with a race to zero margin that hurts everyone.
How to Build a MAP Policy That Works
Set MAP at 80-85% of list price. This gives dealers enough room to advertise competitive pricing without destroying the perceived value of your brand. A $100 list product with MAP at $82 leaves room for dealers to make 15-20% margin at advertised price.
Define exactly what "advertising" means. Website pricing, print catalogs, email campaigns, and marketplace listings are all advertising. Private quotes, in-store negotiations, and phone conversations are not.
Specify enforcement consequences. First violation: written warning. Second: temporary loss of promotional pricing. Third: suspension from the dealer program. If you don't enforce it, the policy is worthless.
Monitor regularly. Assign someone to check online pricing monthly. There are automated tools for this, but even a manual spot-check catches the worst offenders.
I worked with a building materials manufacturer that lost $2.1M in annual margin before implementing MAP. Three dealers were advertising 40% off list on the company's website, which forced 14 other dealers to match or walk. Within six months of enforcing MAP, average transaction prices across the dealer network recovered by 11%.
Where Dealer Pricing Leaks Margin
Here's the part that matters most: the gap between your published dealer price and what you actually collect. In distribution and manufacturing, this gap is typically 8-15% of revenue. That's money you think you're making but aren't.
The standard tool for finding these leaks is a price waterfall analysis. It maps every deduction between list price and pocket price.
The Dealer Price Waterfall
List Price
- Standard Dealer Discount (tier-based)
= Invoice Price
- Off-Invoice Adjustments (freight, handling, returns)
- Rebates and Allowances (volume, co-op, promotional)
- Payment Terms Cost (early pay discounts, extended terms)
= Pocket Price (what you actually keep)
Pocket Margin = (Pocket Price - COGS) / Pocket Price x 100
A real example from a $75M industrial manufacturer I worked with:
| Waterfall Element | Amount | % of List |
|---|---|---|
| List Price | $100.00 | 100% |
| Dealer Discount (Silver tier) | -$25.00 | 25% |
| Invoice Price | $75.00 | 75% |
| Freight Absorption | -$3.50 | 3.5% |
| Co-op Advertising | -$2.00 | 2% |
| Volume Rebate | -$1.50 | 1.5% |
| Early Pay Discount (2/10 net 30) | -$1.50 | 1.5% |
| Return Credits | -$1.00 | 1% |
| Pocket Price | $65.50 | 65.5% |
That's a 34.5% effective discount, not the 25% on the schedule. The extra 9.5 points of leakage came from six different sources that nobody was tracking in aggregate.
The Five Most Common Dealer Pricing Leaks
1. Freight absorption that nobody tracks. Freight is the single biggest leak in distribution. Sales reps offer free shipping to close deals. Over time, absorbed freight costs hit 3-5% of revenue. Put freight costs in your price waterfall and make them visible.
2. Stacked discounts. Dealer discount + promotional discount + volume rebate + early pay discount. Each one seems small. Together they're devastating. A 25% dealer discount, 5% promo, 2% rebate, and 2% early pay nets out to a 34% total concession.
3. Unearned volume rebates. Dealers get enrolled in a rebate program at the start of the year based on projected volume. They don't hit the target. Nobody claws back the rebate. This is surprisingly common. Track quarterly and adjust.
4. Returns and credits without scrutiny. Generous return policies are competitive necessities, but unmonitored returns eat margin. Set a return threshold (2-3% of purchases) and flag dealers who exceed it.
5. Off-schedule pricing by sales reps. One territory consistently gives 5-7% more in off-invoice discounts than any other, with no corresponding increase in volume. This is the kind of pattern a margin leakage analysis catches immediately.
Building a Dealer Pricing Strategy: Step by Step
Here's the practical sequence for companies doing $20M-$200M in revenue that want to move from ad-hoc dealer pricing to something structured.
Step 1: Map Your Current State
Before changing anything, figure out what you're actually doing today. Pull 12 months of transaction data and calculate the effective discount for every dealer. Not the published discount. The actual pocket-price discount including all off-invoice deductions.
You'll find the spread is enormous. When I did this at a $60M distributor, their published dealer discount was 25%. Actual effective discounts ranged from 19% to 43% across 200+ dealers. Nobody in the building knew about the spread.
Step 2: Segment Your Dealers
Group dealers by two dimensions: volume and profitability. Volume alone is misleading. Your largest dealer might be your least profitable if they've negotiated every possible concession.
| Segment | Volume | Profitability | Action |
|---|---|---|---|
| Stars | High | High | Protect and grow |
| Volume Drains | High | Low | Renegotiate terms |
| Hidden Gems | Low | High | Invest to grow volume |
| Underperformers | Low | Low | Restructure or exit |
The "Volume Drains" quadrant is where the real money hides. These are big dealers who've accumulated concessions over years. Moving them 3-5 margin points through better price discipline recovers significant dollars without losing the relationship.
Step 3: Design Your Tier Structure
Use the 3-tier framework above as a starting point. Adjust based on your industry, product margins, and competitive dynamics. Key decisions:
- How many tiers? Three is usually enough. More than four creates confusion.
- What's the qualifier? Annual volume works for most companies. Some add growth rate or product breadth requirements.
- How often do you reassess? Annually. Moving a dealer down a tier mid-year creates conflict.
Step 4: Build the Price Waterfall
Document every element between list price and pocket price. This is your pricing strategy control panel. Without it, you can't measure whether your dealer pricing strategy is actually producing the margins you planned.
Step 5: Set Policies and Communicate
Write down the MAP policy, discount approval thresholds, rebate qualification rules, and exception process. Share them with your sales team and your dealer network. Ambiguity is where margin goes to die.
Step 6: Monitor Monthly
Track pocket margin by dealer, by product category, and by sales rep. Look for drift. In my experience, margins start eroding within 90 days of implementing new pricing unless someone is watching the numbers.
Dealer Pricing in Manufacturing vs. Distribution
The strategy differs based on where you sit in the chain.
If you're a manufacturer setting dealer prices, you control the starting point. Your job is to set a price architecture that leaves room for every channel partner to make money while protecting your brand positioning. Focus on MAP policies, consistent tier structures, and limiting the number of authorized dealers in each territory.
If you're a distributor managing dealer relationships, you're working within the manufacturer's constraints. Your lever is cost-to-serve optimization. Two dealers buying at the same tier can have wildly different profitability based on order patterns, return rates, credit terms, and delivery requirements. A customer margin analysis will show you which dealer relationships are actually worth keeping.
Either way, the math works the same. Every concession between list price and pocket price reduces your margin. Your job is to make sure each concession is intentional, measurable, and tied to something the dealer does for you in return.
What To Do Next
If you're managing dealer pricing in a spreadsheet right now, here's where to start:
- Pull 12 months of transaction data and calculate effective discount rates by dealer. Not the published rate. The actual pocket-price rate.
- Build a price waterfall for your top 20 dealers by volume. Find where the leaks are.
- Segment your dealers into the four quadrants above. Identify your Volume Drains.
- Draft a tier structure using the 3-tier framework. Pressure-test it with your actual cost data.
For companies running 5,000-100,000 SKUs, doing this in Excel gets painful fast. A single pricing diagnostic can surface $200K-$2M in margin opportunities that are invisible in a spreadsheet. Pryse runs that analysis in 24 hours from a CSV upload. No implementation, no 6-month project, just the numbers.
The bottom line: dealer pricing isn't a spreadsheet exercise. It's a strategy that compounds. Every point of margin you recover on dealer transactions flows straight to your bottom line, and for most mid-market companies, there are 3-5 points of margin sitting in the gap between what they think they're charging dealers and what they're actually collecting.
Last updated: Invalid Date
Frequently Asked Questions

Want to analyze your entire product catalog?
Pryse automatically identifies margin leakage across thousands of SKUs. Upload your data and find hidden profit in 24 hours.
One-time $1,499 diagnostic. No subscription required.