McKinsey's 1% Pricing Rule: What It Means for Your Distribution Business
McKinsey found that a 1% price increase drives 22% EBITDA growth for distributors. Here's how to apply that finding to a mid-market distribution company.
In 2019, McKinsey published "Pricing: Distributors' most powerful value-creation lever," an analysis of 130 distribution companies. The headline finding: a 1% improvement in realized price drives a 22% increase in EBITDA for the average distributor.
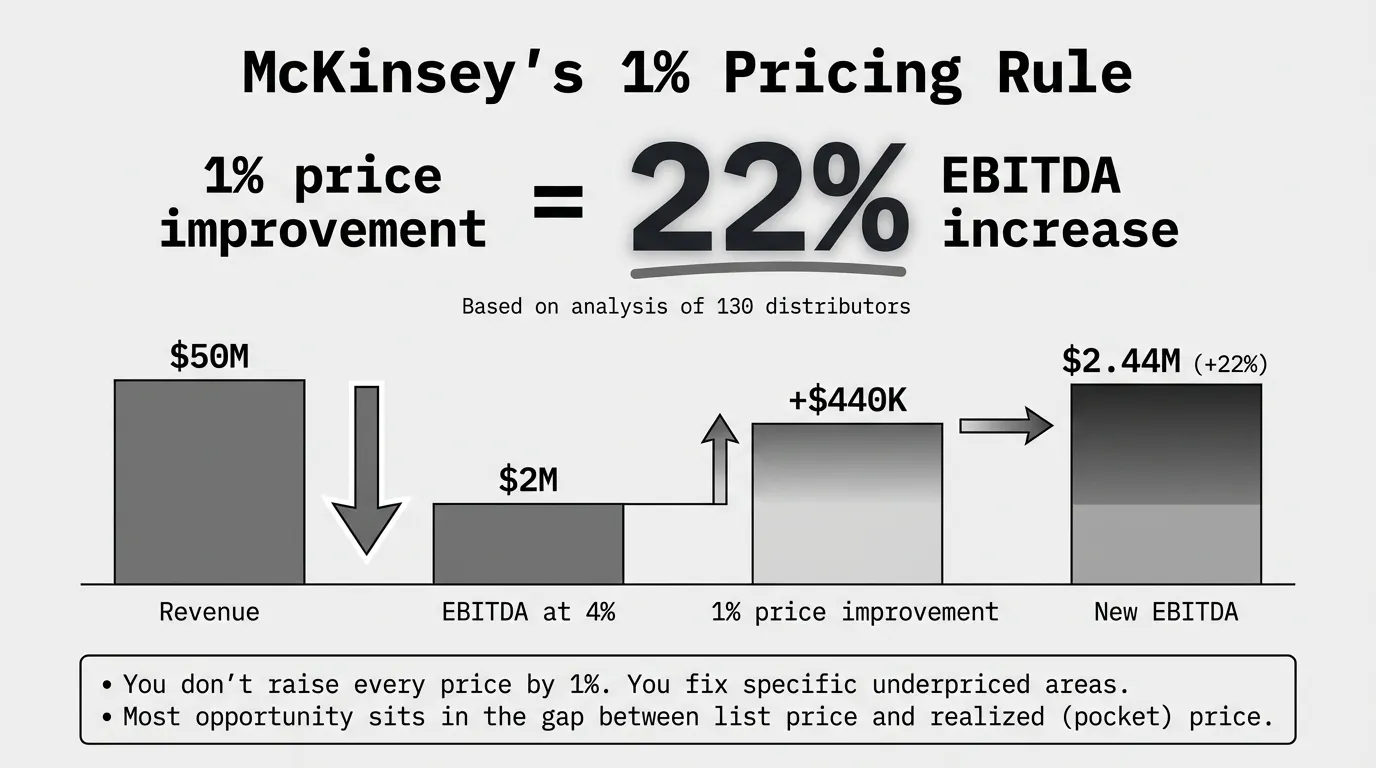
That's not a typo. Not 22% revenue growth. Not 22% gross margin improvement. A 22% jump in EBITDA from a single percentage point of better pricing.
If you run a $50M distribution business at the industry-average 4% EBITDA (documented by SPARXiQ's annual distributor profitability research), your annual profit is $2M. A 1% price improvement — $500K in additional margin — bumps that to $2.5M. That's a 25% increase. McKinsey's 22% figure is the average across 130 companies; your specific multiplier depends on your margin profile.
The math is simple. The implications are significant. And most mid-market distributors are leaving this money on the table.
Why Pricing Has Outsized Profit Impact in Distribution
The McKinsey finding isn't about some special pricing secret. It's about the math of thin-margin businesses.
Distribution operates on narrow margins. The average distributor runs at 4% EBITDA. Elite performers — the top quartile — run at 8-12%, according to SPARXiQ's research. That means for the average distributor, 96 cents of every revenue dollar goes to cost of goods, operating expenses, freight, and everything else.
When margins are this thin, small improvements in realized price have an outsized impact on the bottom line. Here's why:
EBITDA Impact = Price Improvement % × Revenue / Current EBITDA
Example: 1% × $50M / $2M = 25% EBITDA increase
Compare that to the same effort applied to volume or cost reduction:
| Improvement Lever | 1% Improvement | EBITDA Impact | Why |
|---|---|---|---|
| Price improvement | +$500K revenue at full margin | +22-25% EBITDA | Drops directly to bottom line |
| Volume increase | +$500K revenue | +5-8% EBITDA | Carries variable costs (COGS, freight) |
| Cost reduction | -$500K in COGS | +10-12% EBITDA | Already partially optimized at most firms |
Pricing is the only lever where 100% of the improvement drops to the bottom line. Volume gains carry their own cost of goods. Cost reduction efforts typically require investment to achieve. A price improvement — capturing margin you're already entitled to — is pure profit.
McKinsey's 2003 "The Power of Pricing" article in McKinsey Quarterly made a similar point for broader B2B: a 1% price improvement drives an 8% increase in operating profit for S&P 1500 companies. The distribution-specific number is even more dramatic because distributors operate on thinner margins than most industries.
What "1% Price Improvement" Actually Means
Here's where most people misread the McKinsey finding. They think it means "raise all your prices by 1%." That's not what it means, and that's not how it works.
A 1% improvement in realized price is a weighted average across your entire transaction base. It means the average price you actually collect — after every discount, rebate, freight concession, early payment deduction, and credit memo — goes up by one percentage point.
In practice, that average comes from a very uneven distribution:
- Some products go up 5-15%. These are the items where you're significantly below market, where customers have low price sensitivity, or where you've been giving away margin through inertia.
- Some products don't change at all. Your commodity items where you're already at competitive parity. Your strategic account contracts where the pricing is deliberate and justified.
- Some products might go down. If you're overpriced on high-visibility items that customers actively shop, lowering those prices can increase volume and improve your competitive position.
The 1% average emerges from fixing the specific places where margin leaks. It's targeted, not uniform.
The Five Places Mid-Market Distributors Lose Their 1%
McKinsey's research identified specific patterns of margin loss in distribution. Based on that framework and what we see in transaction data at Pryse, here are the five most common sources of that missing 1%:
1. Inconsistent Pricing on the Same SKU
Pull up any product in your catalog and look at the last 100 transactions. How much does the price vary? In most distribution businesses, the same product sold to similar customers in similar quantities shows 10-20% price variance.
Some of that variance is intentional — volume discounts, contract pricing, strategic account terms. But a significant chunk is just noise: different sales reps quoting different prices, stale quotes getting honored months later, and "I'll match whatever the last price was" without checking what that price actually was.
Reducing unwarranted price variance on your top 500 SKUs typically captures 0.3-0.5% of the overall 1% opportunity.
2. Discount Leakage Without Guardrails
NAW (National Association of Wholesaler-Distributors) research indicates that pricing overrides affect 50% or more of transactions at many distributors. That means half or more of your invoices go out at a price different from what your system says they should.
The problem isn't discounting itself — targeted discounts to win or retain business are a normal part of distribution. The problem is discounting without visibility or accountability. When any sales rep can adjust any price by any amount on any deal, the cumulative leakage is significant.
Companies that implement structured discount approval workflows — rep discretion up to 3%, manager approval to 7%, VP approval above that — typically recover 0.2-0.4% of realized price.
3. Off-Invoice Margin Erosion
The gap between invoice price and pocket price is where much of the McKinsey 1% hides. These are costs that don't appear on the customer's invoice but reduce your actual margin:
- Freight absorption: Eating shipping costs on orders below minimum thresholds
- Early payment discounts: 2/10 net 30 terms give customers a 36% annualized return
- Unearned rebates: Volume rebate tiers that 80% of customers automatically hit
- Returns and credits: Generous return policies that customers treat as free inventory management
For a full breakdown of the price waterfall from list to pocket, these off-invoice elements typically account for 3-8% of revenue. Tightening them by just 10-15% relative captures the remaining fraction of the 1%.
4. Stale Contract Pricing
Contract pricing is essential for large accounts. The problem is when contracts don't have cost escalation clauses or regular repricing triggers. A two-year contract signed when material costs were 15% lower is a guaranteed margin leak.
During the 2022-2024 inflation period, some distributors reported that stale contracts accounted for the majority of their margin compression. Even in normal cost environments, contracts without annual cost-adjustment mechanisms erode margin steadily.
5. The Long Tail of Unprofitable Transactions
Most distribution businesses have a long tail of low-dollar, high-cost-to-serve transactions that lose money. An order for $35 of fasteners that requires picking, packing, and shipping costs you $18 in fulfillment before you've accounted for cost of goods. If your margin on the product is 25%, you're making $8.75 in gross profit on an order that costs $18 to fulfill.
Setting minimum order thresholds or adding small order surcharges doesn't eliminate these transactions — it makes them profitable.
Applying McKinsey's Framework to Your Business
The McKinsey research is useful as a benchmark, but the specific opportunity at your company depends on your data. Here's a practical approach to estimating your 1% opportunity:
Step 1: Calculate your current realized margin by segment.
Not list margin. Not invoice margin. Pocket margin — the actual dollars collected after everything is deducted. Break this down by product category and customer tier. The segments with the widest gap between list margin and pocket margin are your highest-opportunity areas.
Step 2: Benchmark your margin against the segment.
SPARXiQ publishes distributor margin benchmarks by industry vertical. If the average industrial distributor achieves 26% gross margin on a product category and you're at 21%, that 5-point gap is the addressable opportunity. You don't need to close the full gap — capturing half of it puts you above average.
Step 3: Quantify in dollars.
Take your total revenue, multiply by the estimated price improvement percentage, and that's your annual profit opportunity. For a $75M distributor, a 1.5% price improvement is $1.125M in additional annual EBITDA. At typical distributor valuations of 8-12x EBITDA, that's $9M-$13.5M in enterprise value creation.
Step 4: Prioritize the quick wins.
Not all of the 1% is equally easy to capture. The first tranche — obvious underpricing, unearned discounts, and off-invoice leakage — can typically be addressed in weeks. The deeper structural changes — contract repricing, customer tiering, value-based pricing for specialty products — take quarters.
What Separates 4% EBITDA Distributors from 8-12% Performers
If the average distributor runs at 4% EBITDA and the top quartile runs at 8-12%, the difference isn't better products or better markets. SPARXiQ's research consistently shows the gap comes down to pricing execution:
Average performers use flat cost-plus markups applied uniformly across the catalog. They give sales reps full pricing discretion. They measure revenue and gross margin but not realized pocket margin. They review prices annually or when costs change.
Top performers use segmented pricing by product-customer combination. They have structured discount governance with approval workflows. They track pocket margin by segment monthly. They review prices quarterly and adjust dynamically. And they treat pricing as a managed function, not an afterthought.
The difference isn't more sophisticated mathematics or expensive software. It's discipline, visibility, and a systematic approach to capturing the margin that's already available in their transaction base.
Getting Started This Week
You don't need to hire McKinsey to capture your 1%. You need to see your own data clearly.
Export 12 months of transaction data from your ERP. Look at three things:
-
Price variance by SKU. How much does the same product sell for across different transactions? Anything above 10% variance on similar-volume orders signals opportunity.
-
Margin by customer. Your top 10 revenue customers are almost certainly not your top 10 profit customers. Find the accounts where you're giving away margin for volume that doesn't justify it.
-
The gap between invoice price and pocket price. Add back every discount, rebate, freight charge, and credit. The difference between what you think you're making and what you actually pocket is where the McKinsey 1% lives.
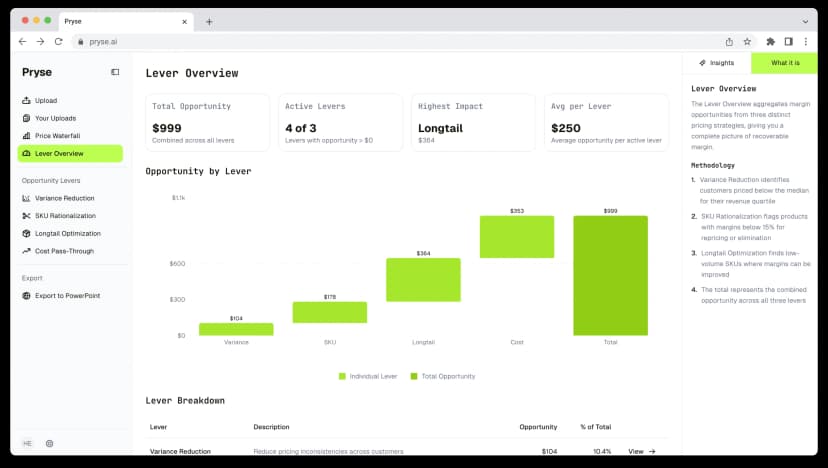
Pryse automates this analysis. Upload your transaction CSV and get a price waterfall visualization, margin leakage quantification, and dollar-prioritized opportunity list in 24 hours. No consultants. No implementation timeline. Just your data telling you where the money is.
For the complete pricing strategy framework, see our Pricing Strategy Guide.
Last updated: March 12, 2026
Frequently Asked Questions
Want to analyze your entire product catalog?
Pryse automatically identifies margin leakage across thousands of SKUs. Upload your data and find hidden profit in 24 hours.
$999/year. Cancel anytime.