Pricing Benchmarking: How to Compare Your Prices Against the Market
A step-by-step guide to benchmarking your prices against competitors and industry standards. Methods, tools, pitfalls, and how to act on the results.
Pricing benchmarking answers a simple question: are your prices where they should be relative to the market, your costs, and what your customers will pay?
It sounds simple. In practice, most mid-market distributors and manufacturers have never done a structured pricing benchmark. They have a general sense — "we're competitive on fasteners, probably high on specialty items" — but no data behind it. And that general sense is often wrong.
McKinsey's 2019 analysis of 130 distributors found that a 1% improvement in realized price drives a 22% increase in EBITDA. Benchmarking is how you find where that 1% is hiding. You can't fix what you can't measure, and you can't measure what you haven't compared against a baseline.
The Three Types of Pricing Benchmarks
Not all benchmarking is the same. There are three distinct approaches, each answering different questions:
1. Internal Benchmarking
This is the easiest to execute and often the most immediately actionable. You compare pricing within your own business — across regions, sales reps, customer segments, or time periods.
What it reveals: Price inconsistency, discount leakage, margin variance by rep or region, and pricing drift over time.
Example finding: Your Midwest region achieves 28% gross margin on the same product mix where the Southeast runs at 22%. Same products, same cost basis, different pricing execution. That 6-point gap is money on the table.
2. Competitive Benchmarking
Comparing your prices against what competitors charge for the same or equivalent products.
What it reveals: Where you're overpriced (risking volume loss), underpriced (leaving margin on the table), or at parity.
The challenge: In B2B distribution, competitor pricing is often opaque. Unlike retail where you can check a website, distributor pricing is negotiated, customer-specific, and confidential. This requires indirect methods, which we'll cover below.
3. Industry Benchmarking
Comparing your overall margin profile and pricing practices against published industry standards.
What it reveals: Whether your margin structure is healthy relative to peers. A distributor running 20% gross margin in a segment where the industry average is 26% has a structural pricing problem, not just a competitive one.
Sources: SPARXiQ publishes distributor margin benchmarks. NAW (National Association of Wholesaler-Distributors), NAED (National Association of Electrical Distributors), and vertical-specific trade associations publish annual benchmarking surveys.
Step-by-Step: Running Your First Pricing Benchmark
Here's a practical process any mid-market company can follow, starting with what you can do this week.
Step 1: Pull Your Transaction Data
Export 12 months of transaction history from your ERP. You need these fields at minimum:
| Field | Why You Need It |
|---|---|
| Product/SKU | To group pricing by item |
| Customer ID | To compare pricing across accounts |
| Transaction date | To spot pricing drift over time |
| Quantity | To normalize for volume differences |
| Invoice price | The price on the invoice |
| Cost (COGS) | To calculate actual margins |
| Discount amount | To measure discount leakage |
| Sales rep / region | To benchmark internal consistency |
If you can also pull freight charges, rebate accruals, and credit memo data, you can calculate pocket price — which is where the real insights live.
Step 2: Calculate Realized Margin by Segment
Build a simple segmentation matrix. Start with product categories on one axis and customer tiers on the other. For each cell, calculate:
- Average realized margin (not list margin — actual pocket margin after all deductions)
- Margin variance (standard deviation of transaction-level margins within the segment)
- Price range (lowest to highest price for the same product within the segment)
This produces your internal benchmark. Any segment with high variance or margins significantly below the overall average is a flag.
Margin Variance = (Highest Transaction Margin - Lowest Transaction Margin) in same segment
Red flag threshold: > 10 percentage points of variance
Step 3: Build Competitive Intelligence (Without Competitor Price Lists)
In B2B, you rarely have access to competitor price lists. But you have several indirect sources:
Win/loss data from your CRM. When you lose a deal on price, record the margin you quoted and any intelligence on the competing offer. Over 6-12 months, this builds a picture of where you're priced out of the market versus where you're losing on other factors.
Sales team surveys. Your reps know more about competitive pricing than any database. Run a structured quarterly survey: "For your top 20 accounts, which product categories do we win on price? Which do we lose? What's your estimate of the price gap?"
The key word is "structured." Anecdotal "the customer says ABC Supply is cheaper" is negotiating noise. A pattern where 8 of 12 reps say you're consistently 10-15% high on a specific product category is actionable intelligence.
Published industry benchmarks. SPARXiQ's Distributor Profit Report provides gross margin benchmarks by distribution vertical. NAW's annual surveys include pricing practice data. These won't tell you what a specific competitor charges, but they tell you what the market supports.
Customer switching behavior. Track which products customers are consolidating away from you. If you're losing share on specific categories to a competitor, pricing is often the driver — especially for commodity items.
Step 4: Compare Internal vs. External Benchmarks
Now overlay your internal data with whatever competitive and industry data you've gathered:
| Segment | Your Margin | Industry Avg | Gap | Opportunity |
|---|---|---|---|---|
| Commodity fasteners | 18% | 22% | -4pts | Underpriced for the market |
| Standard valves | 30% | 26% | +4pts | Above market — check win rates |
| Specialty fittings | 24% | 34% | -10pts | Significant underpricing |
| Safety equipment | 28% | 25% | +3pts | Competitive position is strong |
Segments where you're below industry average in a category with normal win rates are the highest-priority opportunities. You're already winning the business — you could be winning it at a better margin.
Segments where you're above average and losing deals need a different response. You might be overpriced, or the market might be in a race to the bottom that you shouldn't join.
Step 5: Quantify the Dollar Opportunity
Convert the benchmarking gaps into dollar amounts:
Annual Opportunity = Segment Revenue × Margin Gap %
Example: $8M in specialty fittings × 5% recoverable margin = $400K annual profit
Stack-rank your segments by dollar opportunity. In most catalogs, 20% of segments drive 80% of the total opportunity. Start there.
Common Benchmarking Pitfalls
After seeing hundreds of pricing benchmarks, these are the mistakes that trip up mid-market companies most often:
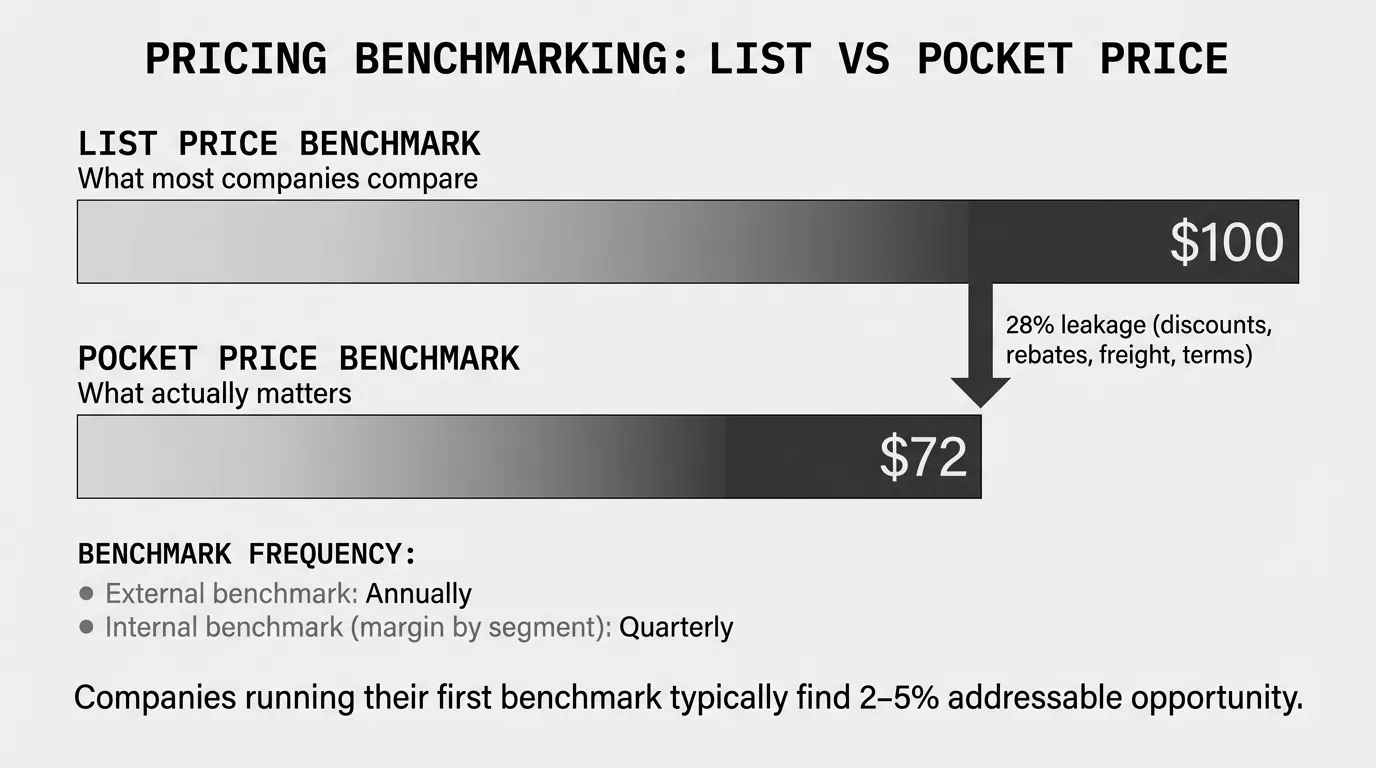
Pitfall 1: Benchmarking List Prices Instead of Realized Prices
Your list price might be perfectly competitive. Your realized price — after the 5% rep discount, the 2% early payment deduction, the freight absorption, and the quarterly rebate — might be 12% lower. Benchmarking list prices gives you a false sense of security.
Always benchmark at the pocket price level. The price waterfall from list to pocket is where the truth lives.
Pitfall 2: Treating All Products as One Benchmark
A blended average margin across your entire catalog tells you almost nothing. A 25% blended margin might mean you're at 15% on commodities (where you should be at 20%) and 40% on specialty items (where you could be at 45%). The blend masks the problems.
Segment your benchmark at minimum by product category and customer tier. The more granular the benchmark, the more actionable the findings.
Pitfall 3: Believing Customer Claims About Competitor Prices
When a customer says "your competitor quoted $42 on this," there are three possibilities: it's true, it's close to true but missing context (different terms, different quantity, different product spec), or it's a negotiating tactic. Research from the Pricing Society suggests that buyer-reported competitor prices are inaccurate 40-60% of the time.
Don't ignore these claims. But don't reprice your catalog based on them either. Validate through multiple data points before adjusting.
Pitfall 4: One-Time Benchmarking Without Follow-Up
A pricing benchmark is a snapshot. Markets move. Costs change. Customer mix shifts. A benchmark that's 12 months old is describing a market that no longer exists.
Build a quarterly review cadence. It doesn't need to be a full-blown analysis every quarter — tracking your top 10 segments against the benchmarks you've established is enough to catch drift early.
Pitfall 5: Benchmarking Without Action Framework
The most common failure mode isn't bad analysis — it's good analysis that goes nowhere. You run the benchmark, produce a report, present it to leadership, and nothing changes because there's no process for translating findings into price changes.
Before you benchmark, agree on the decision framework: "If we find segments more than 3 points below industry average, we'll develop a repricing plan within 30 days." Without that commitment, benchmarking is an academic exercise.
Benchmarking Tools and Resources
For mid-market companies, here's what's available:
Your own ERP data + Excel. This covers internal benchmarking. Export transaction data, build pivot tables by segment, calculate variance. It's manual but free. Most companies start here.
Industry associations. SPARXiQ, NAW, NAED, ISA, and vertical-specific groups publish annual benchmarking reports. Typical cost: $500-$2,000 for member access. These give you the external comparison points.
CRM win/loss tracking. If your CRM tracks deal outcomes and competitive mentions, you already have competitive benchmarking data sitting in your system. Most companies just haven't structured it for pricing analysis.
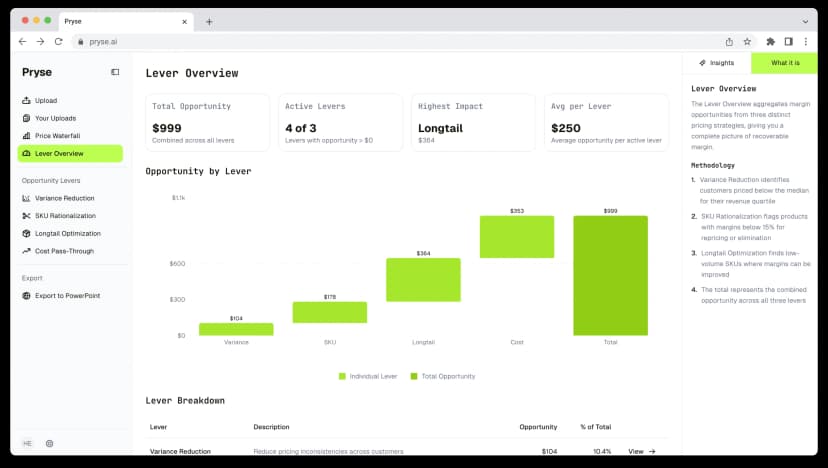
Pryse. Upload a CSV of your transaction data and get automated benchmarking in 24 hours: margin by segment, price variance analysis, leakage quantification, and dollar-prioritized opportunity identification. It automates the internal benchmarking workflow that takes weeks in Excel.
From Benchmark to Action: The 30-Day Playbook
Benchmarking without action is just accounting. Here's how to turn findings into margin improvement:
Week 1: Share findings with stakeholders. Sales leadership, finance, and operations all need to see the data. Present the dollar opportunity, not just the margin percentages. "$400K in annual profit from specialty fittings repricing" motivates action. "We're 5 points below benchmark on specialty fittings" does not.
Week 2: Prioritize the top 5 segments. Pick the segments with the largest dollar opportunity and the lowest execution risk. Typically these are segments where you're below market on products where customers have demonstrated low price sensitivity (low switching behavior, stable volumes).
Week 3: Build repricing recommendations. For each priority segment, determine the target price point, the expected margin improvement, and the risk mitigation plan. Which customers get the new pricing first? How will sales reps communicate the change?
Week 4: Execute first wave. Update prices in your ERP. Brief the sales team. Monitor order patterns for the first 30 days to catch any volume impact early. Most companies find that price increases of 3-5% on strategically selected items produce zero measurable volume loss.
For the complete framework on pricing optimization after benchmarking, see our Pricing Optimization Guide. For the diagnostic step that precedes benchmarking, see our guide on pricing diagnostics.
Last updated: March 12, 2026
Frequently Asked Questions
Want to analyze your entire product catalog?
Pryse automatically identifies margin leakage across thousands of SKUs. Upload your data and find hidden profit in 24 hours.
$999/year. Cancel anytime.