What Is a Price Optimizer? A Plain-English Guide for B2B Companies
A price optimizer analyzes transaction data to recommend better prices. Learn how they work, what they cost, and whether your business actually needs one.
A price optimizer is software that analyzes your historical transactions, costs, and market conditions to tell you where your prices are wrong and what to charge instead. That's it. No black magic, no AI hype — just math applied to your own data.
The price optimization software market reached roughly $1.68 billion in 2025 and is growing at over 16% annually. That growth is driven by companies finally realizing that pricing decisions based on cost-plus formulas and sales rep intuition leave serious money on the table.
For mid-market distributors and manufacturers running $20M-$200M in revenue with 5,000-100,000 SKUs, the question isn't whether better pricing would help. It's whether you need a full-blown price optimizer or something simpler to start.
This post explains what price optimizers actually do, how they work under the hood, what they cost, and how to decide if your business is ready for one.
How a Price Optimizer Works
Every price optimizer follows the same basic loop, regardless of whether it costs $999/year or $500,000 a year.
Step 1: Ingest your data. The optimizer pulls in transaction history — every invoice line with SKU, customer, price, quantity, cost, and date. Most tools need 6-12 months of history to identify meaningful patterns.
Step 2: Segment and analyze. The software groups your transactions by product category, customer type, order size, region, or whatever dimensions matter for your business. Within each segment, it calculates price distributions, margin spreads, discount patterns, and volume trends.
Step 3: Identify problems. This is where the value lives. The optimizer flags:
- Margin outliers: SKU-customer combinations where you're selling at significantly lower margins than similar transactions
- Price inconsistency: The same product sold at wildly different prices to similar customers
- Discount leakage: Where negotiated discounts, rebates, or overrides erode your realized price below targets
- Underpriced products: Items where you have pricing power (low elasticity) but charge less than the market supports
Step 4: Recommend new prices. Based on the analysis, the optimizer suggests price adjustments — usually as a target price range or specific price point for each SKU-customer-channel combination.
Step 5: Measure impact. After implementation, the tool tracks whether the recommended prices stuck, what volume changes occurred, and the net margin impact.
The sophistication varies enormously between tools. A simple optimizer might flag your bottom-20% margin products and suggest raising them to the segment median. An enterprise platform uses machine learning to predict the exact price-volume tradeoff for each SKU and maximize total margin across your entire catalog simultaneously.
Types of Price Optimizers
Price optimizers fall into four categories based on how they calculate recommendations and who they're built for.
Rule-Based Optimizers
These apply formulas you define. Cost-plus targets, margin floors, competitive price matching rules, customer-tier pricing. You set the logic; the software enforces it across your catalog.
Best for: Companies with under 10,000 SKUs and straightforward pricing structures. Most mid-market distributors start here.
Typical cost: $20K-$60K per year.
Statistical Optimizers
These use regression analysis and statistical models to identify pricing patterns in your data. They calculate price elasticity by product category, identify margin outliers, and suggest prices based on historical price-volume relationships.
Best for: Companies with 10,000-50,000 SKUs that have enough transaction history to build reliable statistical models.
Typical cost: $50K-$150K per year.
Machine Learning Optimizers
ML-based tools train models on your transaction data, competitor pricing, market signals, and customer behavior to predict optimal prices dynamically. They improve over time as they process more data.
Best for: Companies with 50,000+ SKUs, high transaction volume, and complex customer-specific pricing. Usually enterprise-scale businesses.
Typical cost: $100K-$500K per year plus implementation.
Diagnostic Tools
These analyze your existing pricing to identify margin leakage and quantify opportunities without prescribing ongoing price management. They answer the question "where am I losing money?" rather than "what should I charge every day?"
Best for: Companies still using Excel-based pricing that want to understand their opportunities before investing in ongoing optimization software.
Typical cost: $999/year-$10,000 one-time.
What a Price Optimizer Can (and Cannot) Do
Setting expectations matters. Companies that buy price optimizers expecting them to solve all pricing problems end up disappointed. Here's what the tools actually deliver.
What optimizers do well:
| Capability | How It Helps |
|---|---|
| Margin outlier detection | Finds SKU-customer combos selling 10-30% below segment averages |
| Price consistency analysis | Flags the same product sold at different prices to similar customers |
| Discount analysis | Quantifies how much negotiated discounts erode your target margins |
| Segment pricing | Sets different price targets by customer tier, region, or channel |
| What-if modeling | Tests price change scenarios before you implement them |
What optimizers cannot do:
- Replace sales judgment on strategic accounts. A price optimizer doesn't know that your largest customer is evaluating a competitor or that a specific deal opens a new market. Human context matters.
- Fix bad cost data. If your cost figures in the ERP are wrong, every price recommendation built on those costs is wrong too. Garbage in, garbage out.
- Overcome organizational resistance. The hardest part of price optimization isn't finding the opportunities — it's getting sales teams to implement higher prices. That's a leadership problem, not a software problem.
- Work without transaction history. New products, new markets, and new customer segments don't have enough data for statistical optimization. You need other approaches for those.
Signs Your Business Needs a Price Optimizer
Not every company needs one. If you're running a focused catalog of 500 SKUs with stable pricing, a spreadsheet review twice a year might be enough. But certain patterns suggest it's time for better tooling.
You probably need a price optimizer if:
-
Your sales team sets prices by gut feel. If reps are quoting prices based on what they think will win the deal rather than data on what similar deals close at, you're leaving margin on the table.
-
You can't explain your margin variance. When someone asks why gross margin was 28% this quarter instead of 32%, and the answer takes a week of spreadsheet work to figure out, you have a visibility problem.
-
Price overrides are common. SPARXiQ data shows that pricing overrides affect 50%+ of transactions at many distributors. If your reps routinely override list prices, you need to understand whether those overrides are justified or habitual.
-
You have 5,000+ active SKUs. Below this threshold, a skilled pricing analyst with Excel can manage reasonably well. Above it, the combinatorics of SKUs, customers, and channels make manual optimization impractical.
-
Your last price review was more than 6 months ago. If you're not reviewing prices at least quarterly, market changes and cost shifts are quietly eroding your margins.
How to Evaluate Price Optimizers
Skip the feature-comparison matrix and focus on three questions.
Question 1: Does it work with the data I actually have?
Most mid-market companies can export 6-12 months of transaction data from their ERP as a CSV. If the optimizer requires live API integration with SAP, real-time competitor feeds, and a data warehouse you don't have, it won't work — regardless of how good its algorithms are.
Question 2: Can my team act on the recommendations?
A price optimizer that produces a 50-page report nobody reads delivers zero value. The output needs to translate directly into actionable price changes your sales team and pricing manager can implement within your existing workflow.
Question 3: What's the realistic payback period?
For every $100K you spend on a price optimizer, you should expect at least $300K in recovered margin within the first year. If a vendor can't show you case studies with clear ROI metrics from companies similar to yours, be skeptical.
McKinsey's research on 130 distributors found that a 1% improvement in realized price translates to a 22% increase in EBITDA. For a $50M distributor running 4% EBITDA, that 1% price improvement is worth $440K annually. Even a modest diagnostic that finds half a percent pays for itself many times over.
Price Optimizer vs. Doing It in Excel
Let's be honest: most mid-market companies are doing their pricing in Excel today. And it's working well enough to keep the business running. The question is whether "well enough" is leaving money on the table.
What Excel can do:
- Maintain price lists and cost-plus calculations
- Run basic margin reports by product or customer
- Track price changes over time
- Calculate simple competitive price indexes
Where Excel breaks down:
- Scale. Analyzing pricing patterns across 10,000 SKUs, 500 customers, and 3 years of history creates workbooks that crash.
- Speed. A quarterly price review in Excel takes weeks. A price optimizer does it in hours.
- Consistency. Different analysts build different spreadsheets with different assumptions. Results vary depending on who runs the analysis.
- Segmentation depth. Excel can't easily analyze margin patterns across the intersection of product category, customer tier, region, channel, and order size simultaneously.
The right move for many companies isn't jumping from Excel to a $200K annual platform. It's running a one-time diagnostic to understand where your margin leakage lives, then deciding whether ongoing optimization software is worth the investment based on what you find.
Getting Started Without a Six-Figure Investment
You don't need to sign a multi-year enterprise contract to start optimizing prices. Here's a practical sequence that works for mid-market companies.
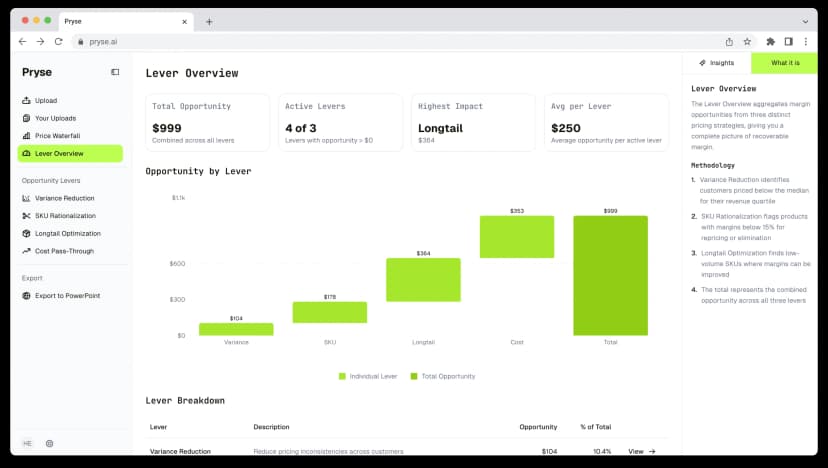
Month 1: Run a diagnostic. Upload your transaction data to a tool like Pryse for $999/year and get a clear picture of where margin leakage exists — which SKUs, which customers, which discount patterns. This gives you a baseline and a prioritized list of opportunities.
Months 2-3: Capture the easy wins. The diagnostic will identify products where you're clearly underpriced relative to similar transactions. Raise those prices. Most companies recover 1-3% margin just from fixing obvious inconsistencies.
Months 4-6: Build the business case. Use the margin improvement from quick wins to justify investment in ongoing optimization if the opportunity is large enough. If the diagnostic shows $2M in annual margin opportunity, a $50K-$100K annual platform makes sense. If the opportunity is $200K, it doesn't.
Month 7+: Implement the right tool for your scale. Whether that's a mid-market platform like Pricefx, an enterprise tool like Vendavo, or a better Excel process with quarterly diagnostic check-ups, let the data guide the decision.
The worst approach is buying a $200K platform before you understand where your pricing problems actually are. That's how you end up 12 months into an implementation project that never quite delivers the ROI you were promised.
The Bottom Line
A price optimizer is just a tool that makes your pricing data useful. The expensive ones do it continuously and automatically. The simple ones do it once and give you a clear picture. Both have their place.
For most mid-market distributors and manufacturers, the right first step isn't buying the biggest optimizer on the market. It's understanding your current pricing — where the gaps are, how much margin you're leaving on the table, and which fixes deliver the fastest payback. Start there, and the right next investment becomes obvious.
Last updated: March 12, 2026
Frequently Asked Questions
Want to analyze your entire product catalog?
Pryse automatically identifies margin leakage across thousands of SKUs. Upload your data and find hidden profit in 24 hours.
$999/year. Cancel anytime.