How to Run a Pricing Audit (Without Hiring a Consultant)
A practical checklist-based approach to auditing your pricing policies, execution, and compliance. Find the gaps between pricing intent and pricing reality.
A pricing audit asks one question: are your actual prices matching your intended prices?
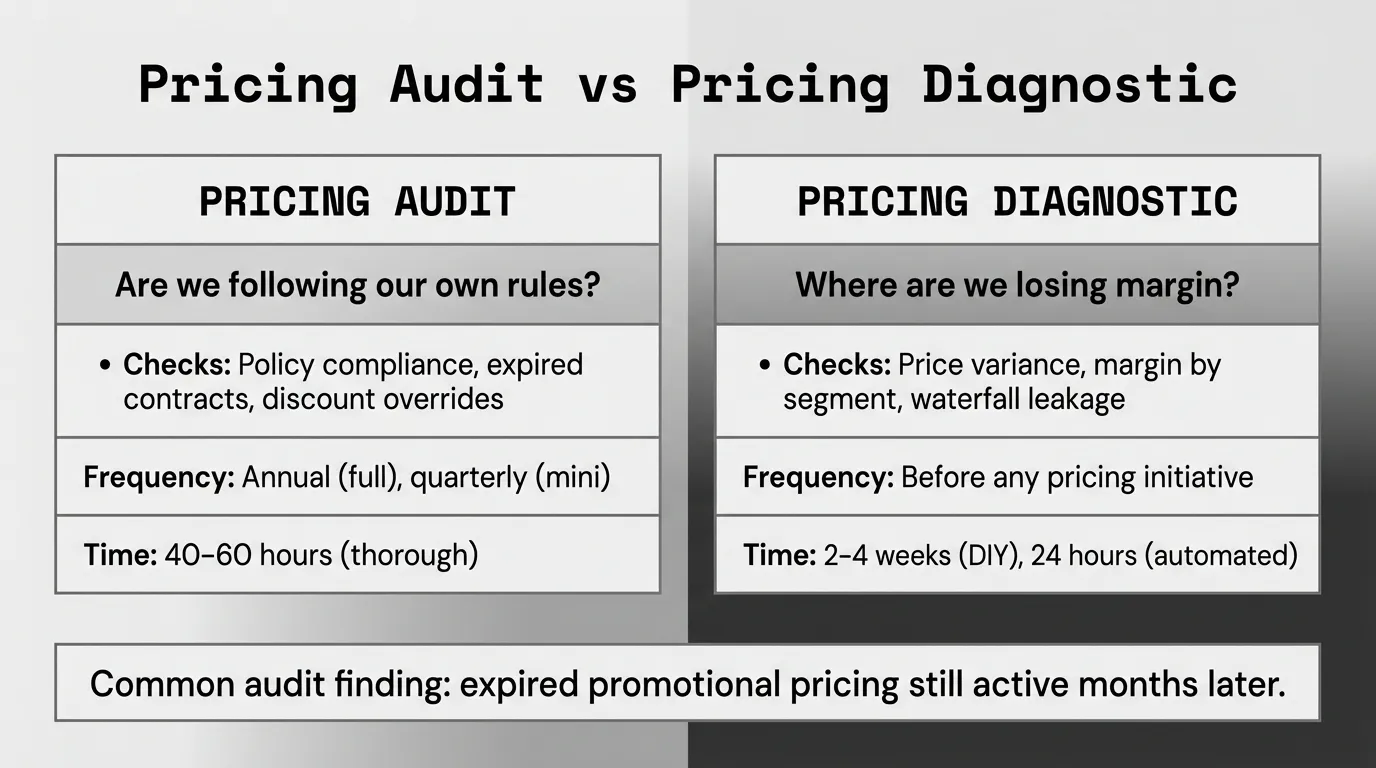
It's not about whether your prices are optimal — that's a diagnostic. It's not about whether your strategy is sound — that's an assessment. An audit checks compliance. Are the rules being followed? Are the systems calculating correctly? Are the contracts being honored — on both sides?
Most mid-market distributors have never formally audited their pricing. The result is a quiet accumulation of errors, policy violations, and process breakdowns that individually seem minor but collectively cost real money. Expired promotional prices that never reverted. Contract terms honored for customers who no longer qualify. Cost increases that weren't passed through because nobody triggered the update. These aren't strategic failures. They're operational gaps that an audit catches.
Why Pricing Audits Matter More Than You Think
The financial impact of pricing compliance failures is easy to underestimate. Here's what the data shows:
A Deloitte survey of B2B companies found that pricing errors — incorrect prices in systems, misapplied discounts, and contract compliance failures — typically cost 1-3% of revenue. For a $75M distributor, that's $750K to $2.25M annually leaking through cracks that nobody's watching.
McKinsey's 2019 research on distributor pricing found that a 1% improvement in realized price drives a 22% EBITDA increase. The pricing audit often reveals that portion of the 1% which isn't about strategy or optimization at all — it's about enforcing the pricing you already have.
The Pricing Audit Checklist
Here's a systematic checklist you can execute internally. Work through each section, flag any findings, and quantify the dollar impact where possible.
Audit Area 1: Price List Integrity
What to check:
- Are all products in your ERP priced? (Look for $0 prices, null values, or placeholder amounts)
- Do prices reflect current costs? (Compare last cost update date to last price update date for each major category)
- Are there duplicate SKUs with different prices? (Common after ERP migrations or acquisitions)
- Are discontinued or superseded products still priced? (Customers may still order them at stale prices)
- Is the markup/margin correct for each product category per your pricing policy?
How to check: Export your full price list from the ERP. Sort by last-updated date. Products not updated in 12+ months are audit flags. Cross-reference costs against sell prices to verify margin targets are met.
Common finding: 5-15% of SKUs have prices that don't reflect current costs. The longer since the last full price review, the more stale pricing you'll find.
Audit Area 2: Discount Policy Compliance
What to check:
- Is there a written discount policy? (If not, that's finding #1)
- What percentage of transactions involve a discount or price override?
- Do override amounts stay within defined approval thresholds?
- Are approvals documented? (Can you trace a discount to an approval?)
- Are there patterns — specific reps, regions, or customer types — where override rates are significantly above average?
How to check: Pull all transactions with a discount applied over the past 12 months. Calculate override frequency by rep, region, and customer segment. For a sample of overrides above the standard threshold, check whether approval records exist.
Common finding: Discount policies exist on paper but aren't enforced in the ERP. Reps bypass the approval workflow by adjusting the quote before it enters the system, or managers auto-approve without review. NAW research indicates override rates above 50% at many distributors — a sign that the policy and the practice have diverged.
Audit Area 3: Contract Compliance
What to check:
- Are all active contracts loaded into the pricing system?
- Do system prices match contract terms? (Sample 20-30 contracts and verify)
- Have expired contracts been removed from the system? (Or are customers still getting expired rates?)
- Do contracts with cost-escalation clauses have prices that reflect current costs?
- Are volume-tier thresholds in contracts being tracked? (Is the customer actually hitting the volume that earns their price tier?)
How to check: Pull your list of active contracts. For each one, compare the contract terms to what the system charges. Check contract expiration dates against current pricing in the ERP. For volume-based contracts, compare actual customer volumes against tier thresholds.
Common finding: 10-20% of "active" contracts in the system are expired but still applied. Customers receive contract pricing they no longer qualify for because nobody updated the system when the contract lapsed. In the other direction, some customers without contracts receive contract-level pricing because a rep set it up informally.
Audit Area 4: Cost Pass-Through Timeliness
What to check:
- When manufacturer costs change, how long does it take for your selling prices to update?
- Is there a defined process for cost-change pass-through? (Who initiates? Who approves? What's the target timeline?)
- During the last 12 months, were there cost increases that didn't get reflected in selling prices?
- Are there product categories where cost increases were absorbed rather than passed through?
How to check: Pull a list of all cost changes in the past 12 months. For each one, check the date the selling price was updated. Calculate the lag in days. Anything above 30 days is a flag — that's a month of margin erosion on every transaction.
Common finding: Average cost-to-price update lag of 45-90 days at companies without an automated pass-through process. During the 2022-2024 inflationary period, some distributors found that delayed cost pass-through was their single largest source of margin compression.
Audit Area 5: Rebate and Incentive Accuracy
What to check:
- Do customer rebate accruals match actual customer volumes?
- Are rebate tiers producing the intended behavior? (If 80% of customers hit the top tier, the tiers aren't differentiating)
- Are vendor rebates being tracked and claimed? (Unclaimed vendor rebates are free money left on the table)
- Are special pricing agreements (SPAs) from manufacturers being applied correctly and claimed back?
How to check: Compare rebate accrual records against actual customer purchase volumes. Check SPA claim rates against eligible transactions. Calculate what percentage of available vendor rebates are being captured.
Common finding: Vendor rebate capture rates of 85-92% are typical — meaning 8-15% of earned rebates go unclaimed. On a $75M book with $3M in eligible rebates, that's $240K-$450K left on the table annually.
Audit Area 6: System and Process Integrity
What to check:
- Can all users who modify prices be identified? (Audit trail exists?)
- Are there pricing overrides happening outside the ERP? (Side deals, manual credits, off-system agreements)
- Do pricing rules in the ERP match your documented policy? (System configuration vs. policy documents)
- Are price changes tested before deployment? (A decimal point error on a bulk update can be expensive)
How to check: Review user permissions in your ERP's pricing module. Pull an audit trail of price changes for the past quarter. Interview the operations team about how pricing changes flow through the system.
Common finding: Too many users have pricing modification privileges. At one distributor, 47 people could change prices in the ERP — including warehouse staff who needed to process returns but shouldn't have been adjusting selling prices.
Quantifying Audit Findings
For each finding, estimate the annual dollar impact:
| Finding | Calculation | Example |
|---|---|---|
| Stale cost pass-through | Lag days × daily transactions × margin gap | 60 days × $30K/day × 3% = $54K |
| Expired contracts honored | # transactions × price difference vs. current | 500 × $12 avg difference = $6K |
| Unapproved discounts | Override $ above policy × % that shouldn't have been approved | $800K × 25% = $200K |
| Unclaimed rebates | Eligible rebates × (100% - capture rate) | $3M × 10% = $300K |
| Price list errors | # errors × transaction volume × avg error amount | 200 SKUs × 50 transactions × $3 = $30K |
Add these up. The total usually surprises people. Mid-market distributors routinely find $200K-$500K in annual leakage from compliance failures alone — before you even get to strategic pricing optimization.
Building the Audit Into Your Calendar
A pricing audit shouldn't be a one-time event. Build it into your annual rhythm:
Quarterly mini-audits (2-3 hours each):
- Discount override rate and depth trend
- Cost change pass-through backlog
- Contract expiration review (next 90 days)
Annual full audit (40-60 hours):
- Complete checklist above
- All six audit areas
- Dollar-quantified findings with action plan
- Year-over-year comparison if this isn't the first audit
Trigger-based audits (as needed):
- After ERP migration or major system change
- After acquisition integration
- After significant organizational change (new sales leadership, restructuring)
The first audit takes the longest because you're building the process from scratch. Subsequent audits are faster because you have the templates, the data sources mapped, and the baselines established.
From Audit to Action
The audit tells you where reality has drifted from intent. Fixing those gaps is usually straightforward — it's operational work, not strategic reinvention.
Immediate fixes (Week 1): Correct price list errors, remove expired contracts, adjust cost pass-throughs that are overdue. These are data-entry tasks that recover margin starting with the next invoice.
Process fixes (Month 1): Implement the discount approval workflow that exists in policy but not in practice. Reduce the number of users with pricing modification access. Set up automated alerts for cost changes that haven't been passed through within 30 days.
Governance fixes (Quarter 1): Establish the quarterly mini-audit cadence. Assign audit responsibility. Set up the reporting dashboards that make ongoing monitoring possible without repeating the full manual effort.
For the diagnostic that pairs with an audit — finding margin opportunity beyond compliance gaps — see our pricing diagnostic guide. For the broader assessment framework, see our pricing assessment guide.
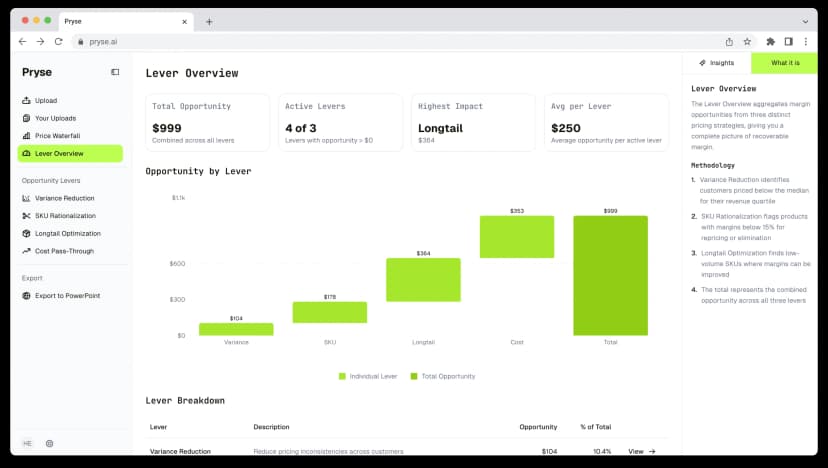
Pryse automates the data analysis portion of both the audit and the diagnostic. Upload your transaction CSV to get a price waterfall visualization, margin variance analysis, and dollar-quantified opportunity list in 24 hours — giving you the data foundation that makes audits faster and findings more precise.
Last updated: March 12, 2026
Frequently Asked Questions
Want to analyze your entire product catalog?
Pryse automatically identifies margin leakage across thousands of SKUs. Upload your data and find hidden profit in 24 hours.
$999/year. Cancel anytime.