Pricing Diagnostic: How to Find Hidden Margin in Your Product Catalog
What a pricing diagnostic is, how to run one yourself, and when software or consultants make more sense. A practical guide for distribution and manufacturing.
A pricing diagnostic is a structured examination of your transaction data to answer one question: where is margin hiding in your business that you're not capturing?
It's not a strategy exercise. It's not a competitive analysis. It's a forensic look at your own data to find the gap between what you should be earning and what you actually pocket.
Most mid-market distributors and manufacturers have never run one. They manage pricing reactively — adjusting when costs change, matching when competitors undercut, discounting when sales reps ask. The result is a catalog with thousands of pricing inconsistencies accumulating over years, each one small enough to ignore individually but collectively worth millions.
McKinsey's 2019 study of 130 distributors puts the number in perspective: a 1% improvement in realized price drives a 22% increase in EBITDA. The pricing diagnostic is how you find that 1%.
What a Pricing Diagnostic Reveals
A good diagnostic produces five specific outputs, each pointing to actionable margin improvement:
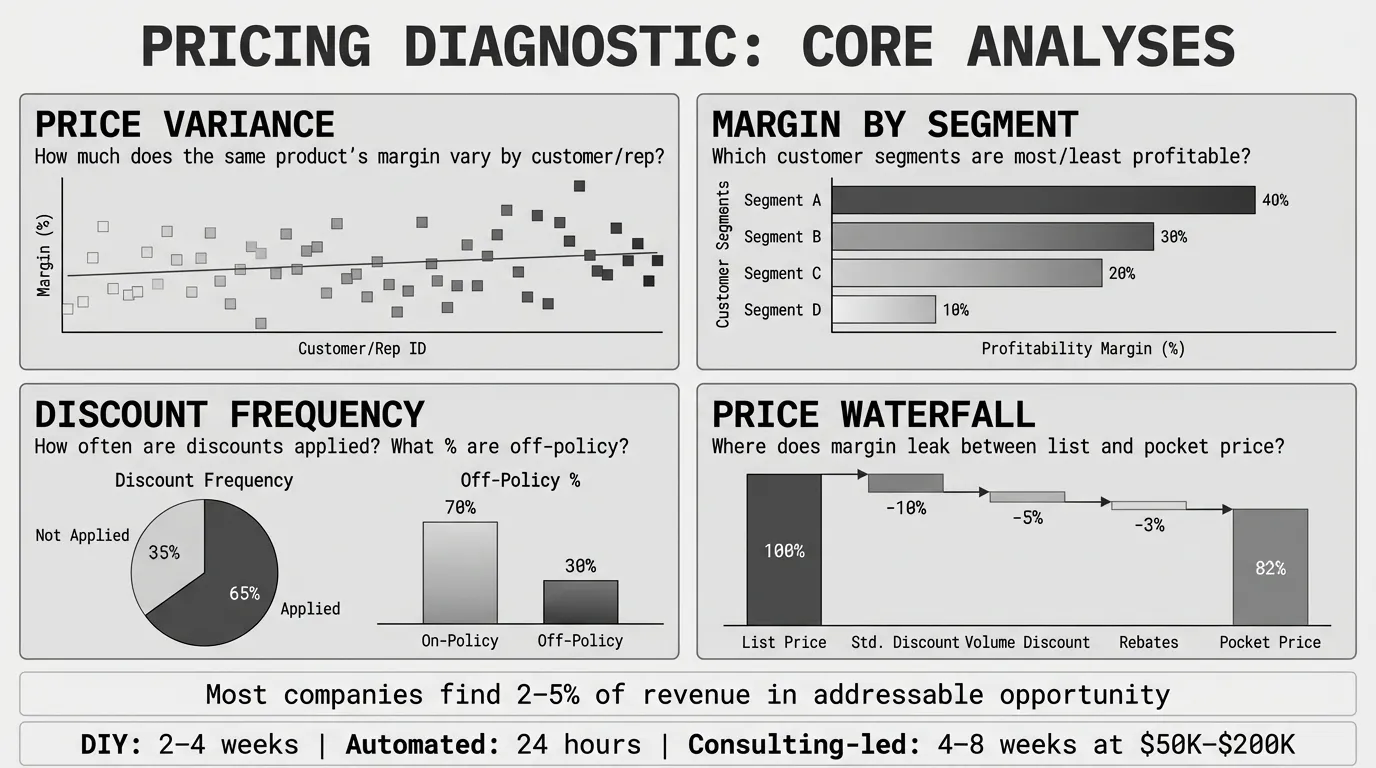
1. Price Waterfall Analysis
The price waterfall traces the path from your list price to the price you actually pocket. At each step — volume discounts, customer-specific adjustments, promotional pricing, freight concessions, early payment terms, rebates, credit memos — margin falls away.
Most companies know their list margin. Few know their pocket margin. The gap between the two is typically 8-15% of revenue in distribution, and the diagnostic quantifies exactly where each point goes.
For a detailed breakdown of the waterfall methodology, see our pocket price waterfall analysis.
2. Margin Scatter Analysis
Plot every customer on a chart with revenue on one axis and margin on the other. The result is usually revealing: your largest customers are not your most profitable, and there's a cluster of mid-size accounts delivering exceptional margins that nobody's paying attention to.
The scatter also reveals outliers — customers with margins far below the segment average. Each outlier is a specific, addressable opportunity.
3. Price Variance by SKU
For any given product, how much does the transaction price vary across customers, reps, and time periods? Some variance is intentional (volume discounts, contract pricing). But unwarranted variance — the same product going out at wildly different prices to similar customers — is pure leakage.
A well-run distribution business should see less than 10% price variance within a defined customer-product segment. Most companies find 15-25% variance on their first diagnostic.
4. Discount Frequency and Depth Analysis
What percentage of transactions involve a price override or discount? What's the average discount depth? Who's giving the discounts?
NAW research shows that pricing overrides affect 50%+ of transactions at many distributors. The diagnostic quantifies the pattern: which reps discount most, which customer segments receive the deepest cuts, and which product categories see the highest override rates.
5. Dollar-Prioritized Opportunity List
The most valuable output is a ranked list of specific opportunities, each quantified in annual dollars. Instead of "our pricing needs work" (which everyone already knows), you get "repricing these 200 SKUs for these 50 customers would recover $380K annually."
That specificity is what turns a diagnostic from a report into an action plan.
The DIY Pricing Diagnostic: Step by Step
You can run a meaningful diagnostic with your ERP data and a spreadsheet. Here's the process:
Step 1: Extract the Data
Pull 12 months of transaction history. The more complete your data, the better the diagnostic. Here's what to extract:
Must-have fields:
- Invoice number and date
- Product/SKU identifier and description
- Customer ID and name
- Quantity sold
- Unit price (invoice price)
- Unit cost (COGS)
- Sales rep or territory
Should-have fields:
- Discount amount or percentage
- Freight charges
- Payment terms
- Product category/family
- Customer segment/tier
Nice-to-have fields:
- Rebate accruals
- Credit memo amounts
- Return quantities
- Order type (stock, special order, drop ship)
Step 2: Build the Margin Map
Calculate gross margin for every transaction:
Transaction Margin = (Unit Price - Unit Cost) / Unit Price × 100
Pocket Margin = (Unit Price - Unit Cost - Discounts - Freight - Rebates - Credits) / Unit Price × 100
Now build pivot tables by:
- Product category: Average margin, min, max, standard deviation
- Customer: Total revenue, total margin dollars, margin percentage
- Sales rep: Average margin on their transactions, discount frequency
- Time period: Monthly margin trend — is it improving or degrading?
Step 3: Identify the Variance Outliers
For each major product category, calculate the coefficient of variation in transaction prices:
Price CV = Standard Deviation of Transaction Prices / Average Transaction Price × 100
Healthy: < 10% | Moderate concern: 10-20% | Urgent: > 20%
Sort by coefficient of variation, descending. The products at the top of the list — those with the widest price spread — are your first investigation targets. Pull the individual transactions and ask: why is Customer A paying $54 and Customer B paying $67 for the same product in the same month?
Some answers are legitimate (different contract terms, different volumes). Many are not (different reps quoting different prices, stale quotes honored past expiration, "the customer asked for a discount and we said yes").
Step 4: Build the Price Waterfall
For your top 100 SKUs by revenue, calculate the average drop at each waterfall step:
| Waterfall Step | Average Price | Cumulative Drop |
|---|---|---|
| List price | $100.00 | — |
| After volume discounts | $95.00 | -5.0% |
| After customer-specific pricing | $91.20 | -8.8% |
| After rep discretionary discounts | $88.46 | -11.5% |
| After freight absorption | $86.69 | -13.3% |
| After early payment deductions | $84.96 | -15.0% |
| After rebates and credits | $83.11 | -16.9% |
That 16.9% gap between list and pocket is the territory where margin hides. The diagnostic tells you which steps account for the most leakage and whether those steps are intentional or accidental.
Step 5: Quantify and Prioritize
For each finding, estimate the annual dollar opportunity:
- High-variance SKUs: If you brought the bottom quartile of transaction prices up to the segment average, how many dollars would that recover?
- Excessive discounting: If you reduced discount frequency by 20% (through guardrails, not through refusing customers), what's the margin impact?
- Off-invoice leakage: If you tightened freight absorption thresholds and renegotiated early payment terms, what's the annual savings?
Stack-rank these by dollar opportunity. Your action plan starts with the highest-dollar, lowest-risk items at the top.
When to Use Software Instead of Excel
The DIY approach works. But it has practical limits:
Catalog size. Building pivot tables and variance analyses for 500 SKUs is manageable. For 15,000 SKUs across 2,000 customers, you're looking at weeks of manual work — and the chance of errors increases with every formula.
Data integration. The price waterfall requires combining data from multiple systems — ERP for invoices, accounting for credits and rebates, logistics for freight. Merging these in Excel is possible but fragile.
Visualization. Margin scatter plots, waterfall charts, and variance distributions are hard to build and maintain in spreadsheets. They're exactly the kind of analysis that dedicated tools handle well.
Repeatability. A diagnostic should be repeated quarterly. If it takes 3 weeks to produce each time, the cadence won't stick.
Pryse automates the diagnostic workflow. Upload your transaction CSV, and in 24 hours you get the price waterfall, margin scatter, variance analysis, and dollar-prioritized opportunity list. The same analysis that takes weeks in Excel, delivered in a day.
When to Hire a Consultant Instead
A self-serve diagnostic or DIY analysis covers the "what" — where margin leaks and how much is at stake. There are situations where you need help with the "why" and "how":
Your pricing problem is a people problem. If the diagnostic shows that 40% of transactions involve discounts and the sales VP is the biggest discounter, you don't need more data. You need organizational change management. That's a consulting engagement.
You need external market data. The diagnostic tells you about your own pricing. It doesn't tell you what the market will bear. If you need willingness-to-pay research or competitive benchmarking beyond what your sales team can provide, a firm with proprietary industry data adds value.
The opportunity is large enough to justify the investment. If the diagnostic reveals $3M+ in annual margin opportunity, and capturing it requires restructuring your pricing architecture, investing $150K-$300K in consulting support can generate a strong return. The diagnostic gives you the business case.
What Happens After the Diagnostic
The diagnostic is the starting point, not the destination. Here's the typical sequence:
Month 1: Quick wins. Reprice the obvious outliers — products clearly below cost floor, customers receiving discounts with no contractual basis, freight absorption on orders that should carry shipping charges. These changes typically recover 30-40% of the total identified opportunity.
Months 2-3: Structural fixes. Implement discount guardrails, update contract pricing with cost escalation clauses, establish minimum order thresholds. These require more organizational alignment but address the systemic drivers of leakage.
Months 4-6: Ongoing governance. Establish monthly reporting on realized margin by segment, discount frequency, and price waterfall metrics. The diagnostic becomes a baseline against which you measure improvement.
Quarterly: Re-diagnose. Run the diagnostic again. Markets change. Customer mix shifts. New products enter the catalog. A quarterly cadence ensures you catch new leakage before it becomes entrenched.
The companies that get the most value from pricing diagnostics are the ones that treat it as a recurring process, not a one-time project. Your pricing will drift. That's normal. The diagnostic keeps it from drifting too far.
For a deeper framework on assessment methodology, see our pricing assessment guide. For the audit perspective focused on policy compliance, see our pricing audit guide.
Last updated: March 12, 2026
Frequently Asked Questions
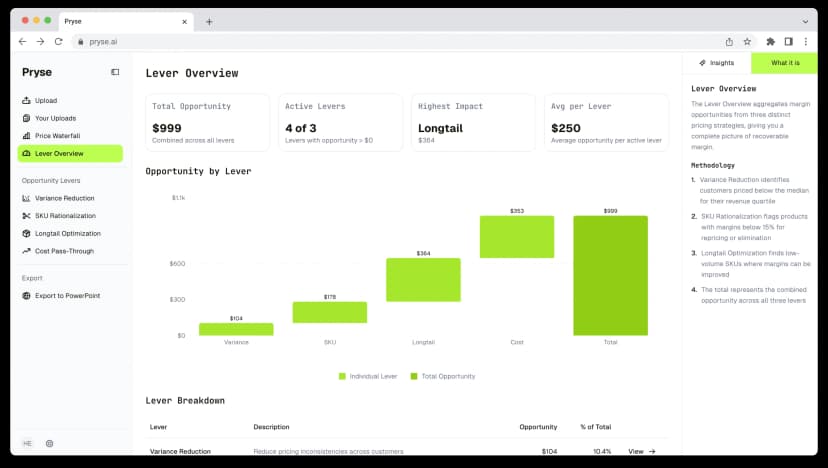
Want to analyze your entire product catalog?
Pryse automatically identifies margin leakage across thousands of SKUs. Upload your data and find hidden profit in 24 hours.
$999/year. Cancel anytime.