How to Audit Your Pricing in 5 Steps (With Checklist)
A step-by-step pricing audit for mid-market distributors and manufacturers. Five concrete steps with data requirements, analysis methods, and action items.
A pricing audit tells you where your money is going. Not your revenue — that's easy to track. Your margin. The difference between what you should be collecting and what you actually pocket after discounts, rebates, freight, and every other cost that erodes the price between catalog and cash.
Most mid-market distributors and manufacturers have never done a formal pricing audit. They review pricing when a customer complains, when a sales rep asks for a bigger discount, or when the quarterly P&L looks wrong. That's reactive. An audit is proactive — it finds the problems before they show up in your financials.
According to SBI Growth Advisory's pricing audit framework, a proper audit examines five dimensions: acquisition, monetization, retention, pricing strategy, and discount execution. For a mid-market company, you can distill this into five practical steps that any finance or pricing team can execute.
Step 1: Gather Your Transaction Data
Everything starts with data. Not summary data. Transaction-level data. Every invoice line from the past 12 months.
Data checklist
Required (minimum viable audit):
- Invoice date
- Customer ID and name
- Product/SKU code and description
- Quantity sold
- Invoice price per unit
- Cost of goods (COGS) per unit
- Any on-invoice discounts or adjustments
- Sales rep or territory
Recommended (full audit):
- List price per unit (before any discounts)
- Customer-specific contracted price (if different from list)
- Freight cost per shipment
- Rebate accruals and payments by customer
- Payment terms and actual days-to-pay
- Return credits and adjustments
- Product category or family code
Where to find it: Your ERP holds most of this. The freight data lives in your TMS or logistics system. Rebate data is usually in a spreadsheet somewhere in finance. Payment terms are in your AR system.
The data pull is the hardest part of the audit. Budget 5-10 hours for a clean ERP with good reporting. Budget 15-25 hours if your data lives in multiple systems that don't talk to each other.
Data quality check
Before you analyze, check the basics:
- Are there products with $0 cost? (COGS data is missing)
- Are there customers with no category or segment? (Segmentation gaps)
- Are there invoice lines with negative amounts that aren't returns? (Data errors)
- Does total revenue match your P&L within 2%? (Completeness check)
Fix obvious data problems before proceeding. Analysis on dirty data produces precise wrong answers.
Step 2: Analyze Margin Distribution
With clean transaction data, calculate gross margin for every invoice line:
Gross Margin % = (Invoice Price - COGS) / Invoice Price
Then look at the distribution. Not the average — the distribution. The average gross margin for a distributor might be 25%. That average hides the reality that some transactions are at 45% and others are at 3%.
What to look for
Transactions below your margin floor. Set a floor — say 15% gross margin. What percentage of transactions fall below it? What percentage of revenue do they represent? For most distributors we analyze, 10-30% of transactions are below a reasonable margin floor.
Customer-level margin dispersion. Calculate average margin by customer. Sort from lowest to highest. The bottom 10% of customers by margin are your immediate attention list. One building materials distributor found that their bottom 40 customers (out of 600) had effective margins under 8% — well below their 24% average.
Product-level margin dispersion. Same exercise by SKU. Products in the bottom decile often have outdated pricing, incorrect COGS, or unintended discount stacking.
Margin by sales rep. This one is politically sensitive but necessary. If Rep A averages 22% margin and Rep B averages 16% on comparable product mix, that gap represents real money. NAW data suggests that pricing overrides affect 50%+ of transactions at many distributors. Those overrides are rep-driven.
Dollar impact calculation
For every category of below-floor transactions, calculate the dollar impact:
Annual Margin Opportunity = Revenue of Below-Floor Transactions x (Target Margin - Actual Margin)
This converts percentage problems into dollar problems, which gets executive attention faster.
Step 3: Build a Price Waterfall
A price waterfall shows how price erodes from list to pocket across every transaction. It's the single most revealing analysis in a pricing audit.
The basic waterfall levels:
- List price — Your published catalog price
- Target price — List minus standard volume or customer-tier discounts
- Invoice price — What appears on the invoice (after on-invoice discounts)
- Pocket price — What you actually collect (after off-invoice deductions)
The gap between each level reveals different types of margin erosion:
- List to target: Intentional, policy-driven discounting
- Target to invoice: Additional on-invoice concessions (rep discounts, promotional pricing, deal-specific adjustments)
- Invoice to pocket: Off-invoice deductions (rebates, freight absorption, early-pay discounts, returns)
McKinsey's research found that the gap between invoice price and pocket price is 15-30% for most B2B companies. Most of that gap is invisible in standard reporting because the costs live in different systems and different budgets.
For a detailed walkthrough of price waterfall construction, see our price waterfall analysis guide.
What the waterfall reveals
The largest bars in your waterfall — the biggest sources of price erosion — are your audit's primary findings. If on-invoice discounting is the biggest bar, your discount policies need tightening. If off-invoice deductions dominate, you need to track and allocate costs that are currently invisible.
Step 4: Check Policy Compliance
With the data analyzed, compare actual pricing behavior against your stated policies.
Discount policy compliance
- What is your maximum authorized discount? What percentage of transactions exceed it?
- Are discount tiers being applied correctly? (e.g., customers in tier 3 getting tier 1 pricing)
- Are promotional discounts still active after the promotion ended?
- Are multiple discounts stacking beyond intended limits?
Pricing file accuracy
- When was each SKU's price last updated?
- How many SKUs have prices older than 12 months?
- Do any SKUs have a list price below current COGS? (It happens more than you'd think)
- Are customer-specific prices aligned with current contracts?
Cost pass-through timeliness
- When did your last supplier cost increase take effect?
- When did your prices change to reflect it?
- What's the average lag in days between cost increase and price increase?
- What revenue shipped during the lag period at the old price?
Each policy violation you find is a specific, quantifiable margin leak. Document each one with the dollar impact.
Step 5: Prioritize and Act
The audit will produce a list of findings. Some will be large dollar amounts, some small. Some will be easy to fix, some politically difficult. Prioritize based on two dimensions: dollar impact and implementation difficulty.
Quick wins (high impact, easy to implement)
- Update stale pricing. SKUs that haven't been repriced in 12+ months and are below margin floor. Fix: update the price file. Timeline: 1-2 weeks.
- Remove expired promotions. Promotional pricing still active past the promotion end date. Fix: update the ERP. Timeline: Days.
- Fix pricing errors. Invoices with incorrect pricing due to system errors, override mistakes, or outdated customer-specific records. Fix: correct the records. Timeline: 1-2 weeks.
Medium-term fixes (high impact, moderate difficulty)
- Tighten discount guardrails. Cap cumulative discounts. Require approval for discounts above a threshold. Implement in the quoting system. Timeline: 30-60 days.
- Implement cost pass-through processes. Reduce the lag between supplier cost increases and your price increases. Create a standing process for quarterly price updates. Timeline: 30-90 days.
- Address below-floor customers. The bottom-margin customers need either price increases, reduced service levels, or intentional acceptance at current margins. Each requires a customer conversation. Timeline: 60-120 days.
Structural changes (high impact, difficult to implement)
- Redesign discount policies. If the discount structure itself is flawed, redesigning it requires cross-functional alignment between sales, finance, and leadership. Timeline: 3-6 months.
- Implement cost-to-serve pricing. Adjusting prices to reflect actual delivery, service, and support costs per customer. Requires data, analysis, and customer communication. Timeline: 6-12 months.
Your Pricing Audit Checklist
Use this as a tracking sheet for your audit:
Data Collection
- 12 months of invoice-level transaction data exported
- COGS data matched to each transaction
- Freight cost data by shipment (if available)
- Rebate agreements and payment data (if available)
- Data quality check completed, errors flagged
Margin Analysis
- Gross margin calculated for every transaction
- Margin distribution analyzed (not just average)
- Below-floor transactions identified with dollar impact
- Customer-level margin ranking completed
- Product-level margin ranking completed
- Sales rep margin comparison completed
Price Waterfall
- List-to-invoice price gap calculated
- Invoice-to-pocket gap calculated (if data available)
- Largest erosion categories identified
- Dollar impact of each waterfall level quantified
Policy Compliance
- Discount policy violations counted and quantified
- Stale pricing (12+ months without update) flagged
- Expired promotions identified
- Cost pass-through lag measured
- Pricing file errors identified
Prioritization
- Findings ranked by dollar impact
- Quick wins identified and assigned
- Medium-term fixes scoped with timelines
- Structural changes flagged for leadership discussion
When to Get Help
A DIY pricing audit works for companies with under 5,000 SKUs and a finance person who can spend 20-40 hours on the analysis. Beyond that, the data complexity grows faster than Excel can handle.
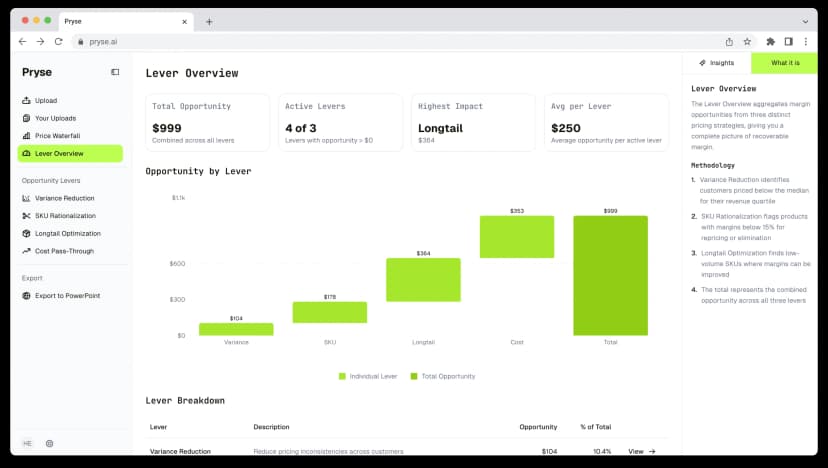
For companies that want professional analysis without the 20-40 hour investment, Pryse delivers a complete pricing audit — margin analysis, price waterfall, leakage identification, and opportunity sizing — for $999/year. Upload your transaction CSV and receive the analysis within 24 hours.
For companies with 20,000+ SKUs or pricing that requires ongoing monitoring, see our best pricing software guide for platforms that automate the audit process.
For broader pricing improvement strategies, see our pricing optimization guide.
Last updated: March 12, 2026
Frequently Asked Questions
Want to analyze your entire product catalog?
Pryse automatically identifies margin leakage across thousands of SKUs. Upload your data and find hidden profit in 24 hours.
$999/year. Cancel anytime.